Private LLM & Secure RAG | | 25 min read
Private LLM Cost: Infrastructure, Operations, and Risk

Key Takeaways
The model bill is usually not the operating bill
A $5K token estimate sits inside a $342K plan
In the bounded managed API scenario, token use is about 1.4 percent of annual operating cost after services, labor, evaluation, change, and response.
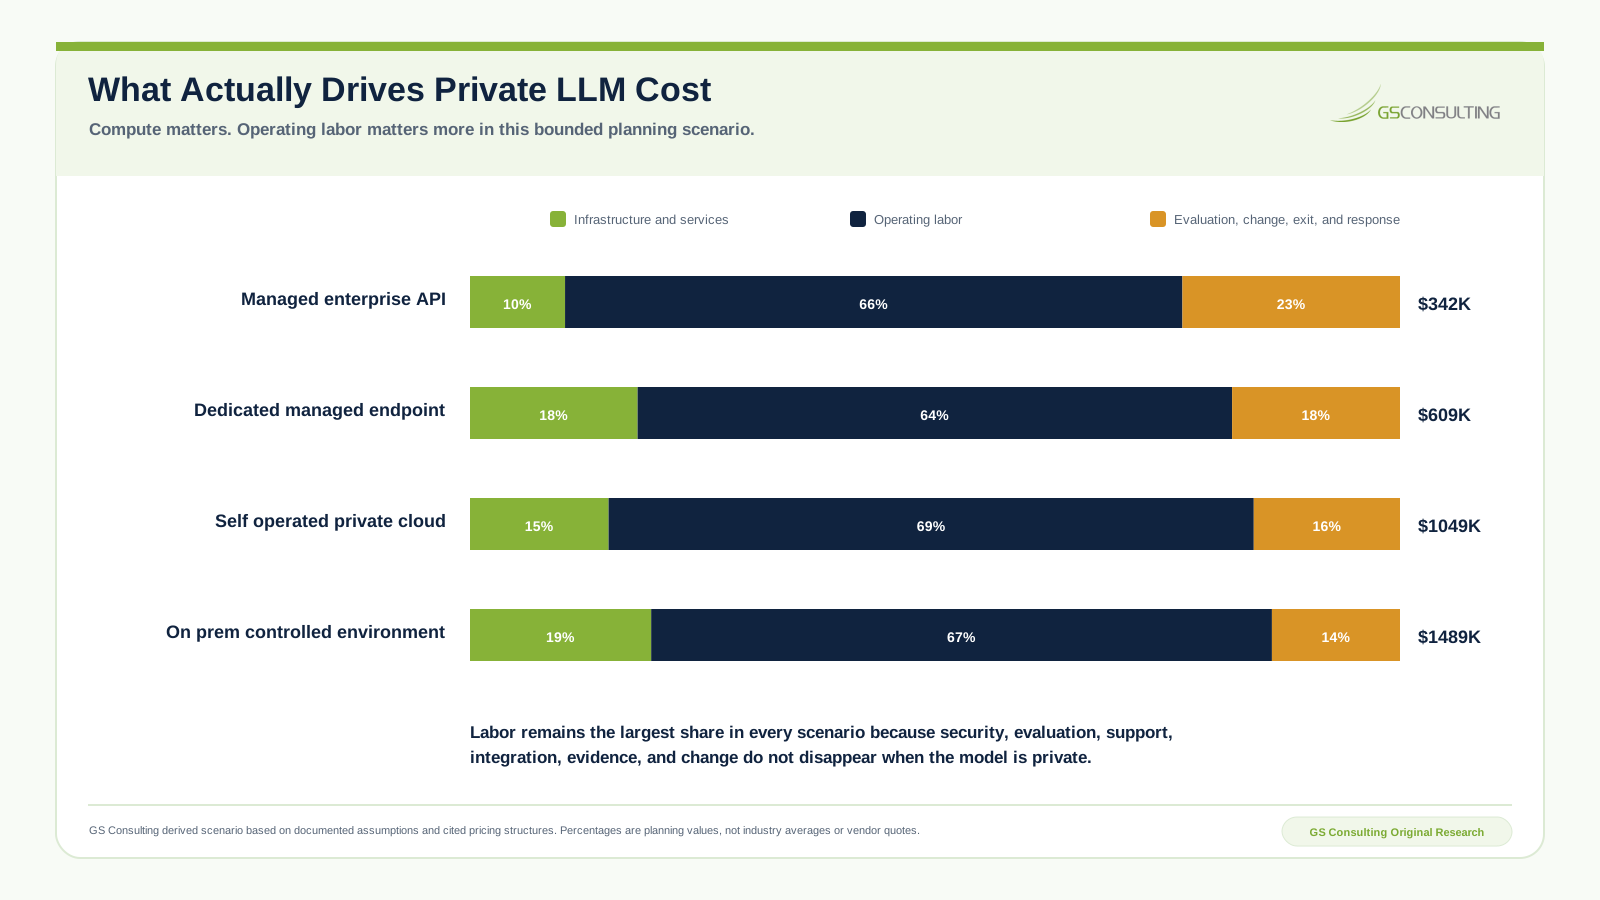
Labor is 64 to 69 percent across four patterns
Platform, security, application, data, compliance, support, and owner time do not disappear when the model is private.
Price accepted work, not generated tokens
A cheap answer that fails review, requires heavy edits, or triggers retries can be more expensive than a higher priced useful result.
Private LLM cost is not the model price. It is the cost of the operating system around the model.
A token rate is easy to find. A GPU quote is easy to request. Neither tells you what it costs to deliver accepted work with the right data, security, reliability, support, evidence, and exit path. Those costs sit in architecture, people, quality, controls, idle capacity, change, and exceptions.
The weak business case multiplies tokens by a public rate and calls the result total cost. The stronger case measures real demand, accepted output, capacity use, service dependencies, loaded labor, evaluation, security, incident readiness, and change. It compares operating patterns under the same workload and keeps every assumption visible.
For a workstream view of the build, use the private AI integration cost and architecture guide. It keeps this operating cost model distinct from the data, connector, identity, evaluation, observation, exception, and support effort required to integrate one bounded workflow.
The Private LLM and Secure RAG hub connects this cost guide to architecture and governance. Use private LLM vs RAG to compare responsibility, private LLM observability to measure accepted cost and operating outcomes, and the private LLM security controls guide to price the control system. GS Consulting supports these decisions through secure AI automation.
Build a private LLM budget that can survive actual operation.
GS Consulting helps teams measure workload, compare deployment patterns, price the full control stack, and set evidence based scale gates.
Build the Cost CasePrivate LLM Cost: The Short Answer
Estimate private LLM cost in seven parts: model use or compute capacity, data and application services, security and compliance controls, loaded operating labor, evaluation and human review, support and incident readiness, and change and exit. Calculate annual total cost and divide it by accepted tasks, not raw requests. Then test the result against low, expected, and high demand; different quality rates; capacity utilization; labor; provider rates; and architecture changes.
A managed API can carry a low visible model bill and a meaningful operating bill. A dedicated endpoint can improve isolation or capacity predictability while adding fixed commitment. A self operated private cloud can provide direct control while shifting platform, security, support, and capacity risk inside the organization. An on prem environment can meet a narrow duty and still be the most expensive choice if hardware, facilities, staffing, redundancy, refresh, and idle capacity are undercounted.
The right option is the lowest total burden that can satisfy the actual data, control, quality, latency, availability, evidence, and continuity duty. More private is not automatically more secure, less risky, or less expensive.
The Private LLM Price Is Not the Private LLM Cost
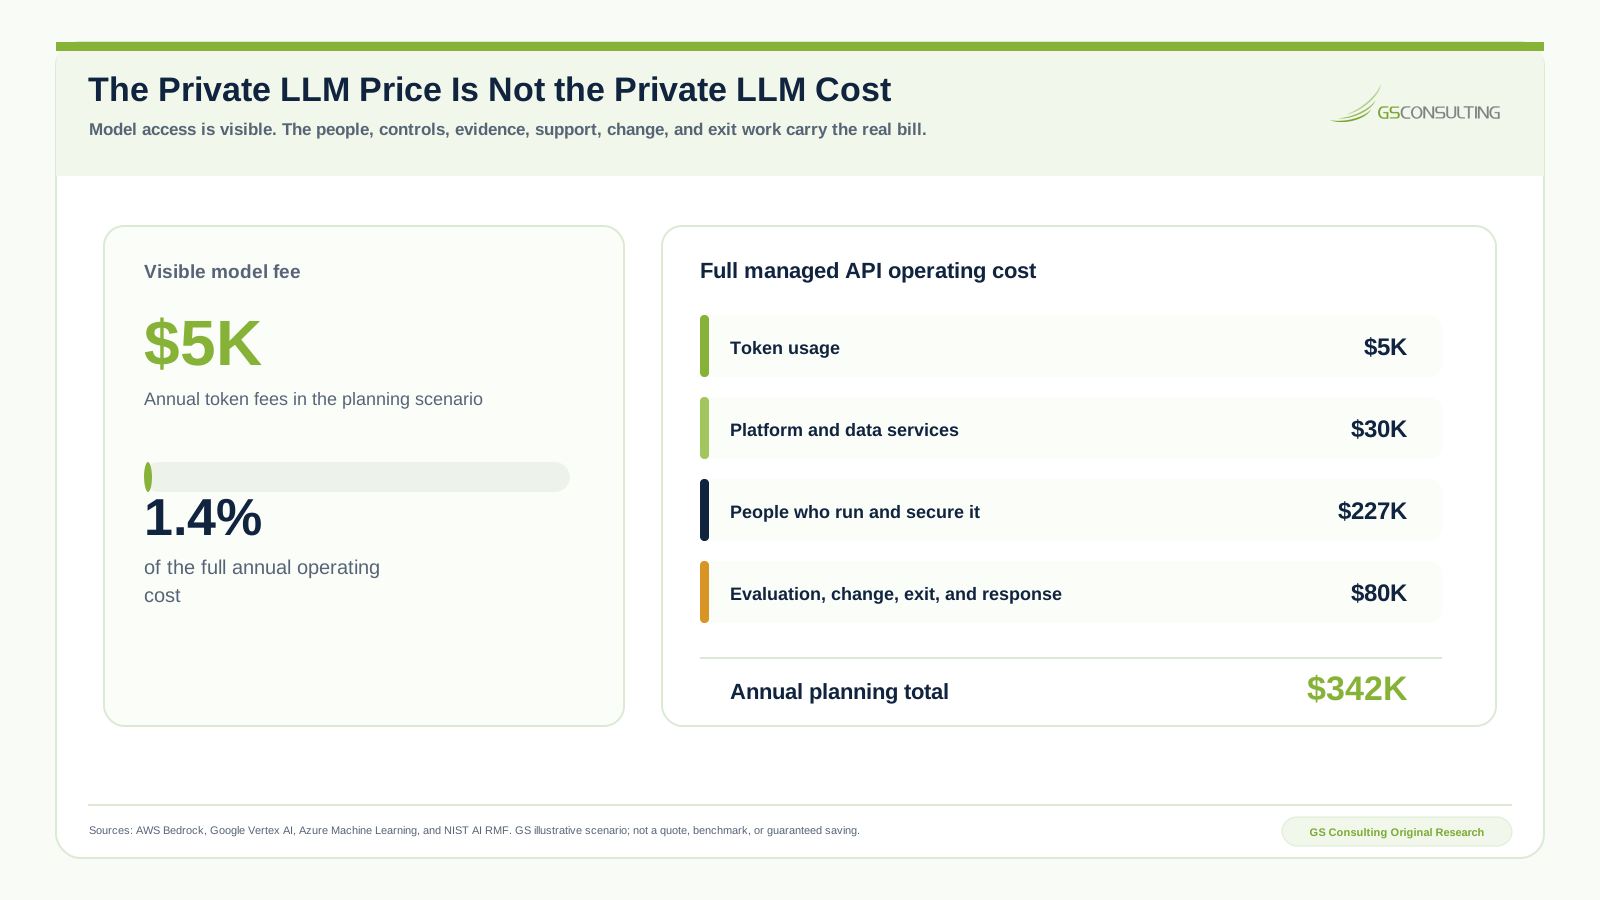
The research scenario uses 300,000 requested tasks per year, a 75 percent accepted output rate, 2,500 input tokens per request, and 600 output tokens. GS applies planning rates of $3 per million input tokens and $15 per million output tokens. Those rates are analyst assumptions for the model, not quoted current prices from a named provider.
That produces about $4,950 in annual token use. Add $30,000 for platform and data services, $227,000 in loaded operating labor, and $80,000 for evaluation, change, exit, and response. The illustrative total is $341,950, or $1.52 per accepted task. The visible token line is about 1.4 percent of that total.
This is not a claim that every managed private LLM costs $342,000. It shows why a narrow price comparison can mislead a decision. Your rates, volume, staff, control burden, quality, support, and architecture may produce a very different result.
Provider pages confirm that pricing structures differ. Amazon Bedrock pricing includes model use and other service patterns. Google Vertex AI generative pricing includes token based and provisioned capacity structures. Azure Machine Learning pricing separates service access from the other Azure resources used by a workload. Use current quotes and exact service terms when building a real budget.
How the GS Private LLM Cost Model Works
GS built four scenarios around one bounded workload. Each scenario produces infrastructure and service cost, loaded labor, assurance and change cost, annual total cost, monthly total cost, accepted task volume, cost per accepted task, and labor share. The point is not to predict a market average. It is to make operating assumptions reviewable.
| Input | GS planning assumption | Replace with |
|---|---|---|
| Annual requests | 300,000 | Measured demand by use case, month, hour, and peak |
| Accepted output | 75 percent | Blind or controlled quality test with business owners |
| Tokens per request | 2,500 input and 600 output | Application traces with sensitive content removed |
| Loaded labor | Role based annual rates from $180,000 to $220,000 | Salary, benefits, overhead, vendor, and owner time |
| Capacity | Documented annual service and compute assumptions | Current quotes, measured throughput, utilization, and reserve |
| Risk and change | Scenario specific planning reserve | Evaluation plan, incident duties, roadmap, contract, and exit work |
The model treats labor as fractional annual capacity, not a claim that every option needs a separate full team. The managed API scenario includes 0.35 of a platform role, 0.20 of a security role, 0.45 of an application and support role, and 0.15 of a compliance role. More controlled patterns increase those fractions as direct infrastructure, reliability, security, support, and lifecycle duties move inside.
Assurance and change includes evaluation, adverse testing, incident exercises, evidence work, version change, migration, and exit readiness. It is shown separately because these activities are often omitted from infrastructure estimates even though NIST AI RMF functions expect risk management across governance, mapping, measurement, and management through the lifecycle.
The GS Private LLM Cost Model is a derived planning tool. It is not a vendor quote, market benchmark, budget approval, accounting opinion, guaranteed saving, or forecast. Replace every assumption with measured workload data, current terms, architecture facts, loaded labor, control duties, and approved financial treatment.
Four Private LLM Cost Scenarios
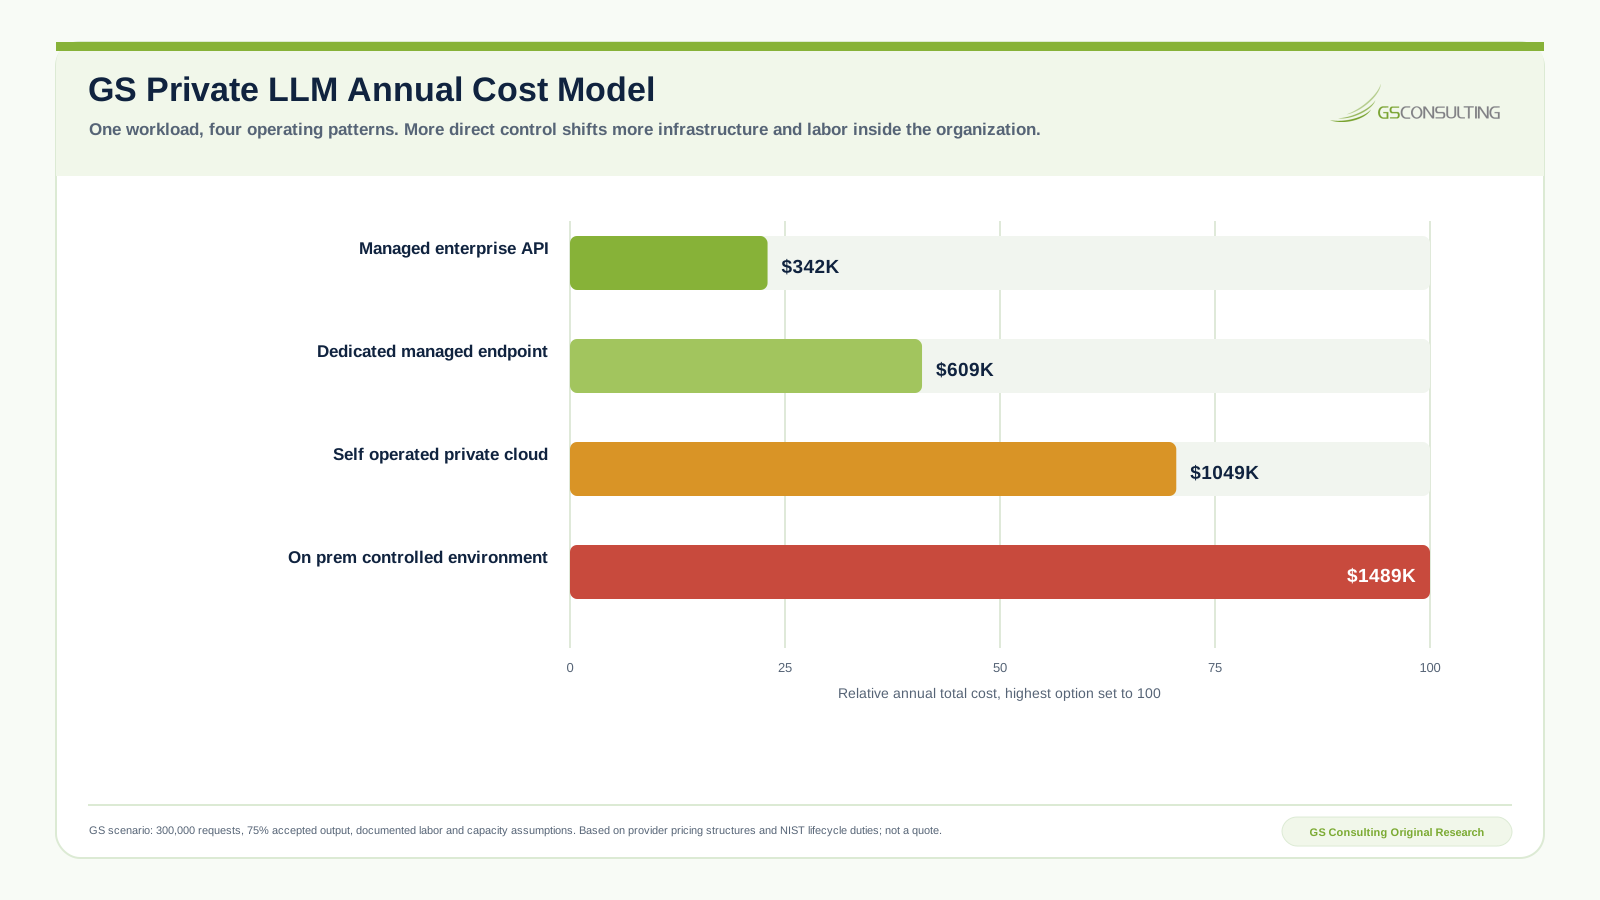
Managed enterprise API: $341,950 per year. Infrastructure and services are $34,950. Loaded labor is $227,000. Assurance and change is $80,000. The scenario produces 225,000 accepted tasks at $1.52 each. It has the lowest direct operating burden, but the organization must still validate data terms, identity, retrieval, logs, evaluation, support, continuity, and exit.
Dedicated managed endpoint: $609,300 per year. Infrastructure and services are $109,800. Loaded labor is $389,500. Assurance and change is $110,000. Cost per accepted task is $2.71. A dedicated pattern may provide isolation, capacity, or contract advantages, but fixed commitment and integration work raise the threshold for an economic case.
Self operated private cloud: $1,049,360 per year. Infrastructure and services are $156,360. Loaded labor is $728,000. Assurance and change is $165,000. Cost per accepted task is $4.66. Direct control expands, along with capacity planning, model serving, patching, security, reliability, support, and change responsibility.
On prem controlled environment: $1,488,500 per year. Infrastructure and services are $290,000. Loaded labor is $993,500. Assurance and change is $205,000. Cost per accepted task is $6.62. The scenario assumes a controlled local environment with meaningful operations and continuity burden. A narrow appliance, shared enterprise platform, or larger workload could produce a different result.
Do not compare these numbers to a provider calculator as though they measure the same object. A calculator can price selected resources. The GS model prices a bounded operating system under explicit workload and labor assumptions. Use both, then reconcile the gap.
What Actually Drives Private LLM Cost
Model and compute. Count input, output, cached context, embeddings, reranking, fine tuning, evaluation, and failed or retried calls. For fixed capacity, measure throughput under the real context length, quantization, model, concurrency, and latency target. A theoretical GPU rate is not usable throughput.
Data and application services. Price storage, vector search, databases, queues, network, identity, secrets, key management, logging, backup, recovery, environments, and application hosting. Add source connectors, data cleaning, permission synchronization, and index rebuilds.
Security and compliance. Include architecture review, access control, encryption, scanning, adverse tests, monitoring, audit evidence, incident exercises, supplier review, privacy work, exceptions, and assessment support. The private LLM security guide provides a full control map to cost.
Loaded labor. Count platform, application, data, security, compliance, procurement, support, and business owner time. Include routine operations, on call work, investigations, access reviews, evaluation, change, vendor management, and reporting. Shared teams still consume capacity.
Quality and review. A generated answer is not necessarily useful work. Price human review, editing, retries, exception handling, fallback, and rework. High consequence uses may need more review even when output quality improves.
Continuity and exit. Budget redundant capacity, backup, recovery tests, model or provider replacement, data export, deletion, contract end, hardware refresh, and retirement. An architecture without a funded exit path can create expensive dependence.
Utilization Decides Whether Fixed Compute Makes Sense
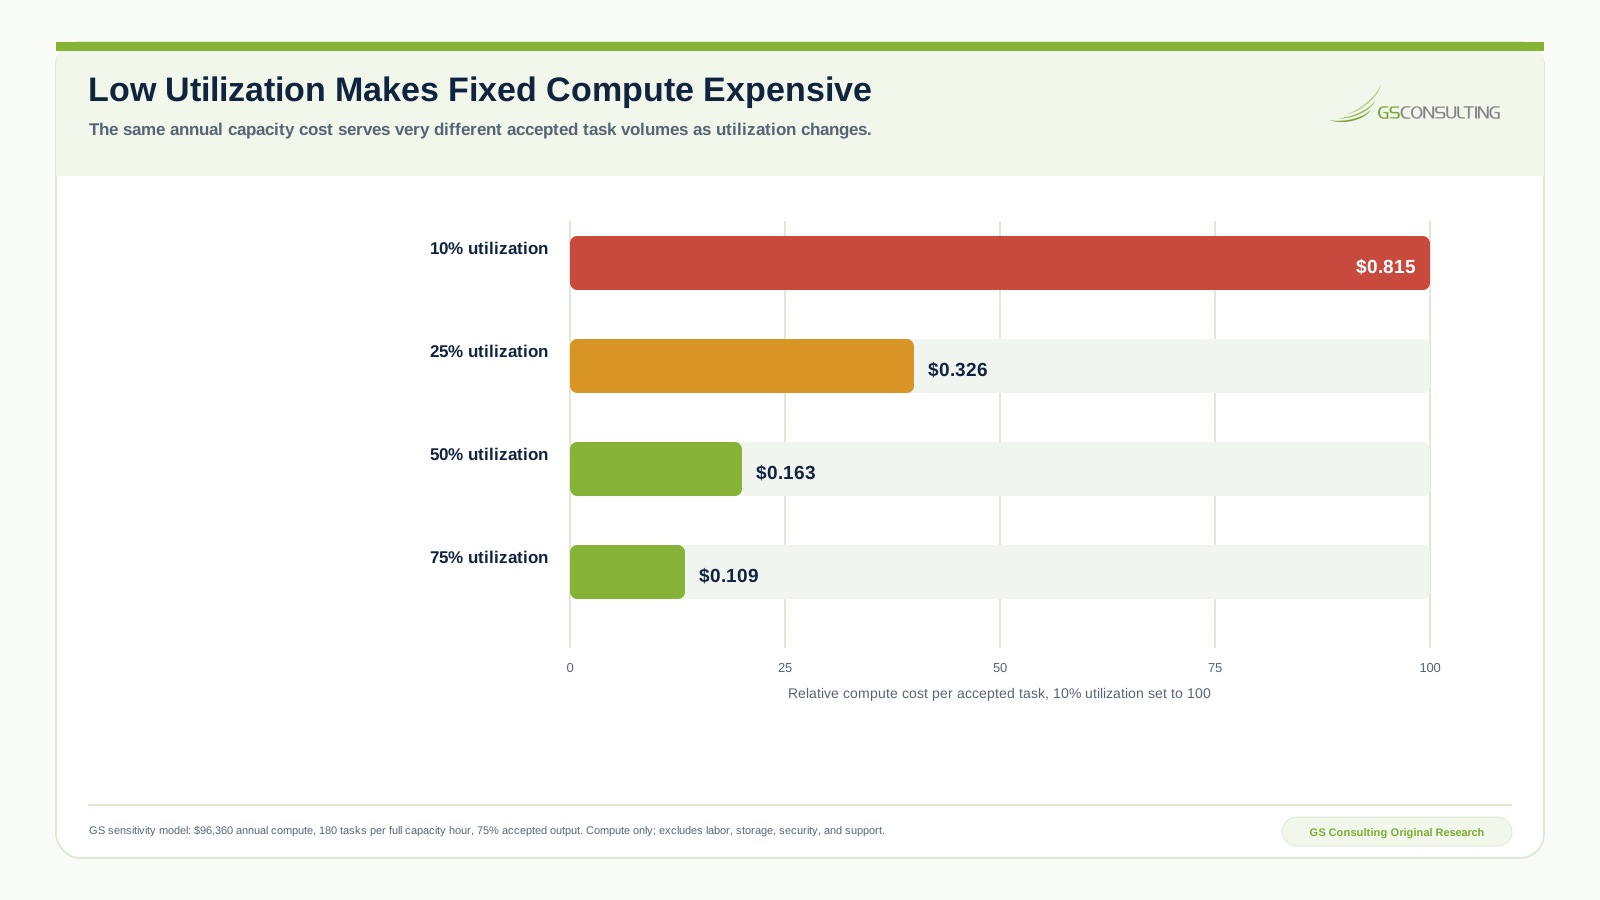
The sensitivity uses $96,360 in annual compute capacity, 180 requested tasks per full capacity hour, and a 75 percent accepted output rate. At 10 percent utilization, compute cost is about $0.815 per accepted task. At 25 percent it is $0.326. At 50 percent it is $0.163. At 75 percent it is $0.109.
This is a compute only comparison. It excludes storage, network, security, labor, support, evaluation, and recovery. It also assumes work can use the capacity. Latency, peak demand, model loading, maintenance, queue design, and data locality can reduce practical utilization.
Low utilization is not automatically waste. Reserve capacity may be a deliberate availability or data boundary decision. The mistake is hiding that reserve inside a rate comparison. Name the duty, cost it, and decide whether a managed burst option, smaller model, shared platform, scheduled batch, or mixed architecture can satisfy the same need.
Measure utilization by useful work, not GPU busy time alone. A system can keep hardware busy generating output that users reject. Pair capacity use with accepted task volume, latency, review time, failure rate, and business outcome.
Use Cost per Accepted Task, Not Cost per Token Alone
The accepted task denominator forces quality into the budget. Define what counts as accepted before the pilot. For a drafting tool, accepted may mean the user used the output after less than a set amount of editing. For retrieval, it may require correct citations and no prohibited disclosure. For structured extraction, it may require field accuracy above an approved threshold.
Record the total request, accepted output, review minutes, edit minutes, retry count, exception count, fallback count, and any downstream correction. A model with a higher use rate can be cheaper if it produces more accepted work and reduces review. A low rate can be expensive when long context, retries, and human cleanup dominate.
Do not count avoided labor before the process changes. If staff still complete the old task and review the new output, the pilot may add cost. Name which step is removed, shortened, or improved; who approves the change; what risk control remains; and when the budget captures the benefit.
Use a range, not one forecast. A credible case includes low, expected, and high values for demand, accepted output, token size, latency, utilization, labor, provider rates, evaluation, incidents, and change. Show which variables can reverse the decision.
A Private LLM Cost Decision Path
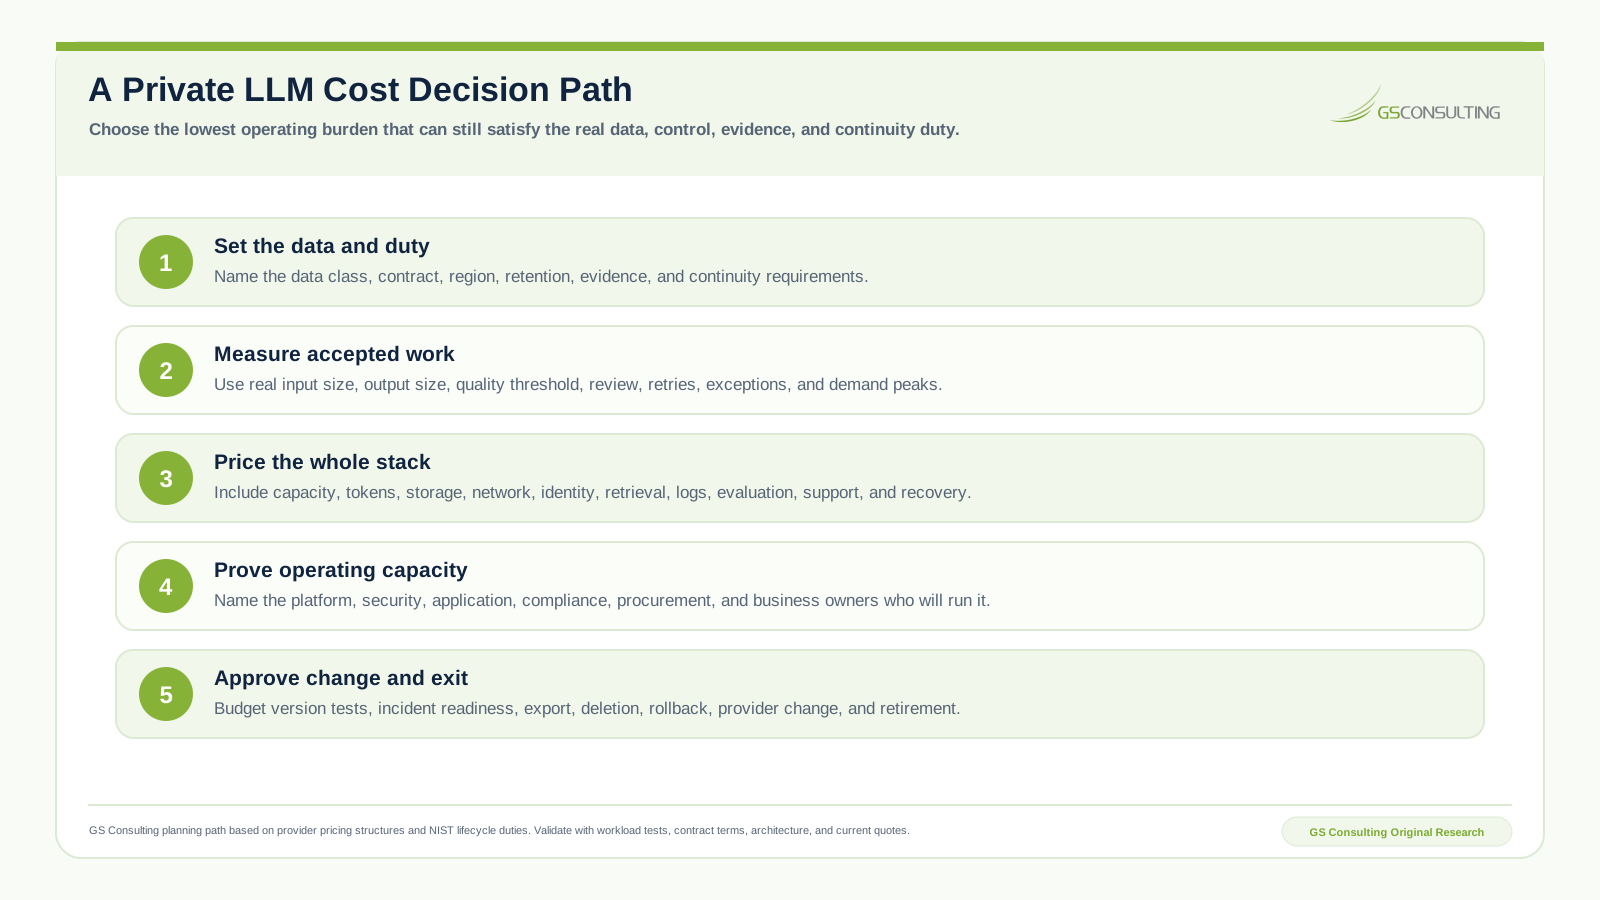
Set the data and duty. Name the data class, contract, region, retention, evidence, support, and continuity requirements. Remove patterns that cannot meet them before spending time on detailed price comparisons.
Measure accepted work. Use representative requests, context, outputs, concurrency, latency, quality, review, retries, exceptions, and demand peaks. Separate steady demand from occasional bursts.
Price the whole stack. Include model use or compute, storage, network, retrieval, identity, logs, backup, evaluation, support, security, and recovery. Apply loaded labor by role and scenario.
Prove operating capacity. Name who will run, secure, evaluate, support, approve, and retire the system. A job title in a diagram is not capacity. Assign an estimated share, rate, service expectation, and funding source.
Approve change and exit. Budget version tests, incident readiness, rollback, export, deletion, provider change, hardware refresh, and retirement. Set a review point where actual cost and quality can stop or reshape the program.
Build the Business Case Around Gates
Start with a small, representative workload and a bounded data set. Establish the current process cost, time, error, backlog, and risk. Run the candidate patterns through the same test set. Measure accepted work, latency, review, exceptions, and operating effort.
Set four gates. The data gate confirms that architecture and terms satisfy the approved boundary. The quality gate confirms accepted output at an agreed review burden. The operating gate confirms named capacity for support, security, evidence, change, and response. The economic gate compares annual total cost and cost per accepted task with the current process and credible alternatives.
Do not force every benefit into labor reduction. Faster cycle time, better search, consistent evidence, improved access control, capacity during demand peaks, and reduced error may create value. State the measure and how it will be observed. Avoid invented dollar values where the organization has no approved method.
Review actuals after launch. Compare volume, tokens, utilization, accepted output, review time, incidents, support, labor, service spend, and change work with the business case. Record variance and decide whether to scale, tune, redesign, renegotiate, or retire.
The Private LLM Cost Evidence Packet
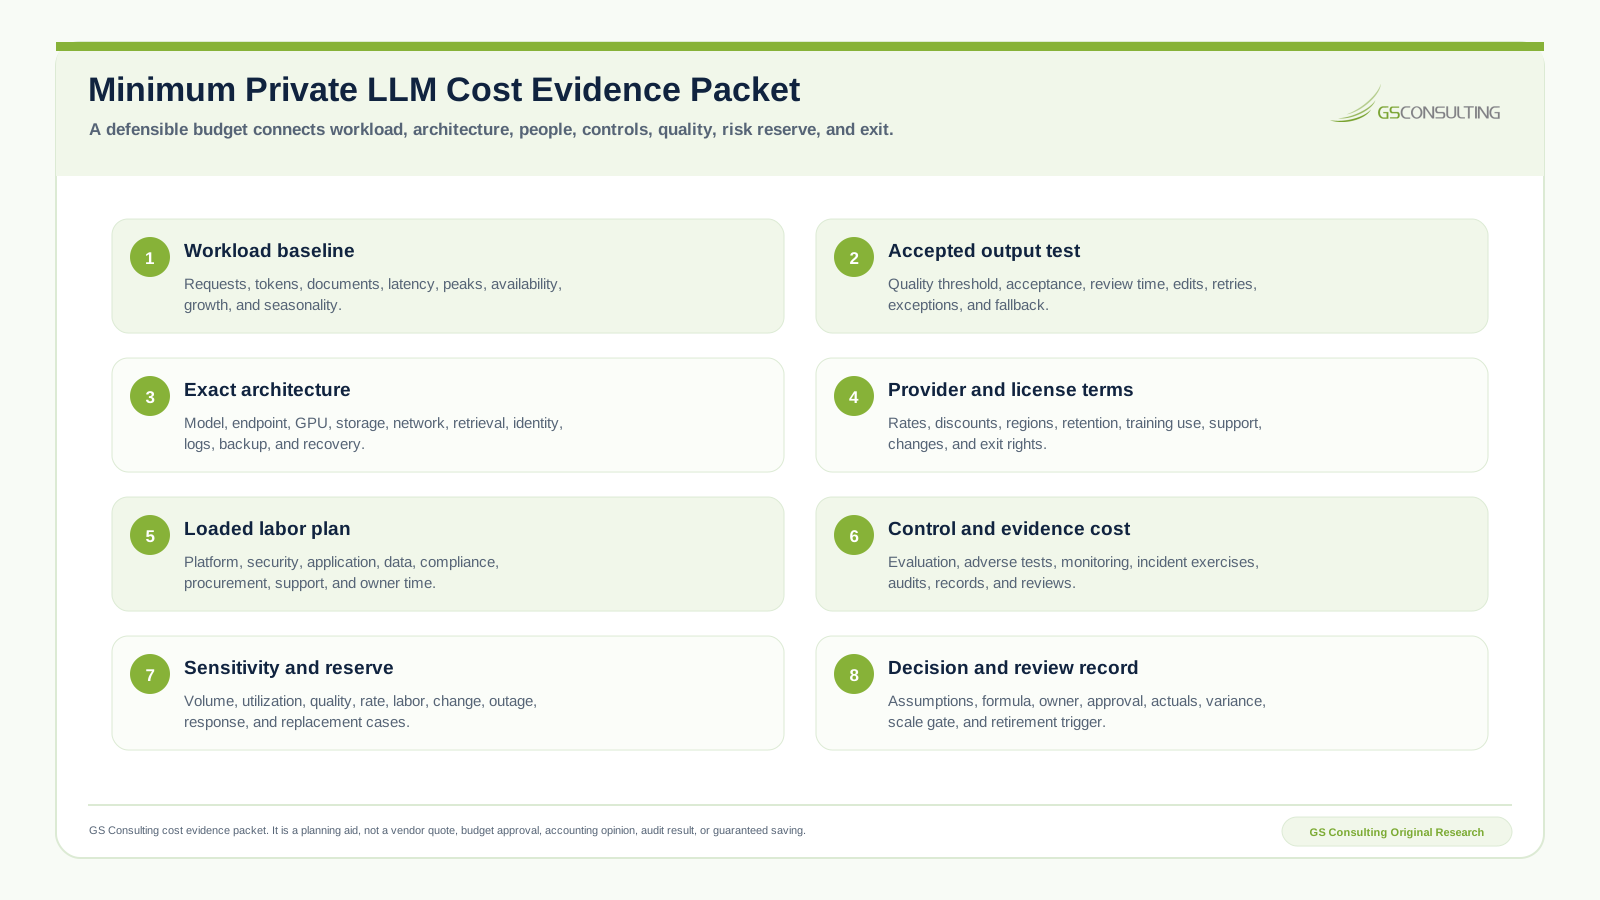
The minimum packet contains a workload baseline, accepted output test, exact architecture, provider and license terms, loaded labor plan, control and evidence cost, sensitivity and reserve, and a decision and review record.
Keep raw observations separate from analyst assumptions. Preserve source URLs, access dates, provider quote dates, model versions, test data, formulas, rates, and scenario logic. Label every derived value. When a price, workload, or architecture changes, update the affected inputs and retain the earlier decision record.
The packet should let a reviewer answer three questions without reconstructing the project from meetings. What is being bought and operated? Which assumptions drive the decision? What result would cause the organization to scale, redesign, or stop?
Bottom Line
Private LLM cost is an operating model, not a token line and not a GPU quote. Data, capacity, services, people, controls, quality, support, change, risk, and exit all belong in the decision.
The decisive standard is simple: every cost has an owner, every assumption has a source, every option faces the same workload and control duty, every output is priced at acceptance, and every scale decision uses actual operating evidence.
Turn private LLM pricing into a defensible operating decision.
GS Consulting helps teams move from provider calculators to measurable workload, complete cost, controlled pilots, and clear scale or stop gates.
Request a Cost ReviewSources and Method Note
- Amazon Bedrock pricing
- Amazon Bedrock custom model cost calculation guidance
- Google Vertex AI generative pricing
- Azure Machine Learning pricing
- NIST AI RMF Core
- NIST AI 600-1 Generative Artificial Intelligence Profile
GS Consulting Original Research. The GS Private LLM Cost Model is a derived planning model based on cited public pricing structures, public lifecycle guidance, and documented analyst assumptions. It is not a vendor quote, market benchmark, budget approval, accounting opinion, guaranteed saving, or forecast. Verify current prices, discounts, terms, workload, architecture, quality, loaded labor, financial treatment, and risk before committing funds.
Frequently Asked Questions
How much does a private LLM cost?
There is no useful single price. Cost depends on workload volume, token size, quality threshold, latency, availability, deployment pattern, capacity utilization, data services, security, labor, support, change, and exit. A defensible estimate should state each assumption and calculate cost per accepted task.
Is a private LLM more expensive than a public API?
Often, but not always. Dedicated or self operated capacity can cost more at low or uneven demand, while provider use fees can rise with sustained volume. The answer changes when data duties, control burden, labor, quality, latency, discounts, and continuity requirements are included.
What is the biggest private LLM cost driver?
In the GS illustrative scenarios, loaded operating labor is the largest component at about 64 to 69 percent of annual cost. This is not an industry benchmark. Teams should replace the labor plan with their own staffing, rates, support model, and ownership assumptions.
How do GPU utilization and demand affect private LLM cost?
Fixed capacity becomes expensive when demand is low, bursty, or poorly scheduled. In the GS compute sensitivity, cost per accepted task at 10 percent utilization is about seven and a half times the cost at 75 percent utilization. Labor and other services are excluded from that comparison.
What should a private LLM cost model include?
Include model use or compute capacity, storage, network, retrieval, identity, logs, backup, environments, licenses, loaded labor, evaluation, security, compliance, support, incident readiness, change, risk reserve, data migration, and exit. Track quality, review, retries, and accepted output too.
Which metric is best for comparing private LLM options?
Use annual total cost and cost per accepted task together. Add cycle time, quality, human review, risk, and service limits. Cost per token is useful for one component, but it does not compare complete operating systems or business outcomes.