DevSecOps | | 24 min read
DevSecOps Metrics That Improve Secure Delivery

Key Takeaways
Measure the decision, not the dashboard
Five current DORA metrics
Delivery performance covers flow, deployment, recovery, failure, and rework. Secure delivery needs more context.
Release evidence scores 97
Complete release evidence ranks first because it connects technical facts to an accountable production decision.
No owner means no metric
Telemetry becomes a management metric only when a named person acts on a defined threshold.
DevSecOps metrics are not a dashboard. They are a decision system for releasing, recovering, remediating, and accepting risk.
Most programs measure what their tools emit. Findings opened. Builds run. Tests passed. Deployments completed. Those numbers are easy to collect and easy to game. They can rise while secure delivery gets worse.
A useful DevSecOps metric names the decision it supports, the release population it describes, the person who owns the response, and the evidence needed to reproduce the number. If nobody changes an action when the metric moves, it is telemetry. Keep it for diagnosis if it helps. Do not put it on an executive scorecard.
The DevSecOps resource hub connects this scorecard to pipeline design, federal delivery, and software supply chain controls. Start with what DevSecOps means as an operating model, use the DevSecOps toolchain guide to connect control coverage and release evidence, and use the DevSecOps security gates guide to separate hard blocks from contextual review. Then use the software bill of materials guide to make component evidence usable. GS Consulting brings the work together through DevSecOps and software supply chain services.
Make every metric earn its place.
GS Consulting helps delivery leaders define the scorecard, instrument the evidence, assign owners, and connect thresholds to real operating decisions.
Plan a Secure Delivery ScorecardDevSecOps Metrics: The Short Answer
Use a balanced scorecard with five views. Flow shows how quickly a change reaches production. Stability shows how often change creates failure or repair work. Security shows how long confirmed exposure persists and what escapes before release. Traceability shows whether provenance and an SBOM are bound to the released artifact. Decision quality shows whether a release, finding, or exception has a complete record and accountable owner.
The first scorecard should fit on one page. Track change fail rate, failed deployment recovery time, critical vulnerability exposure time, release evidence completeness, and artifact provenance coverage. Add change lead time, deployment frequency, deployment rework rate, security finding escape rate, time to actionable security feedback, exception age, and SBOM coverage as the data becomes trustworthy.
Do not copy target values from a generic maturity chart. Establish a local baseline by product and service. Check the distribution, not just the average. Set thresholds from mission consequence, user tolerance, exposure, recovery needs, and delivery economics. Review the target when the system changes.
Public Guidance Points to a Measurement System
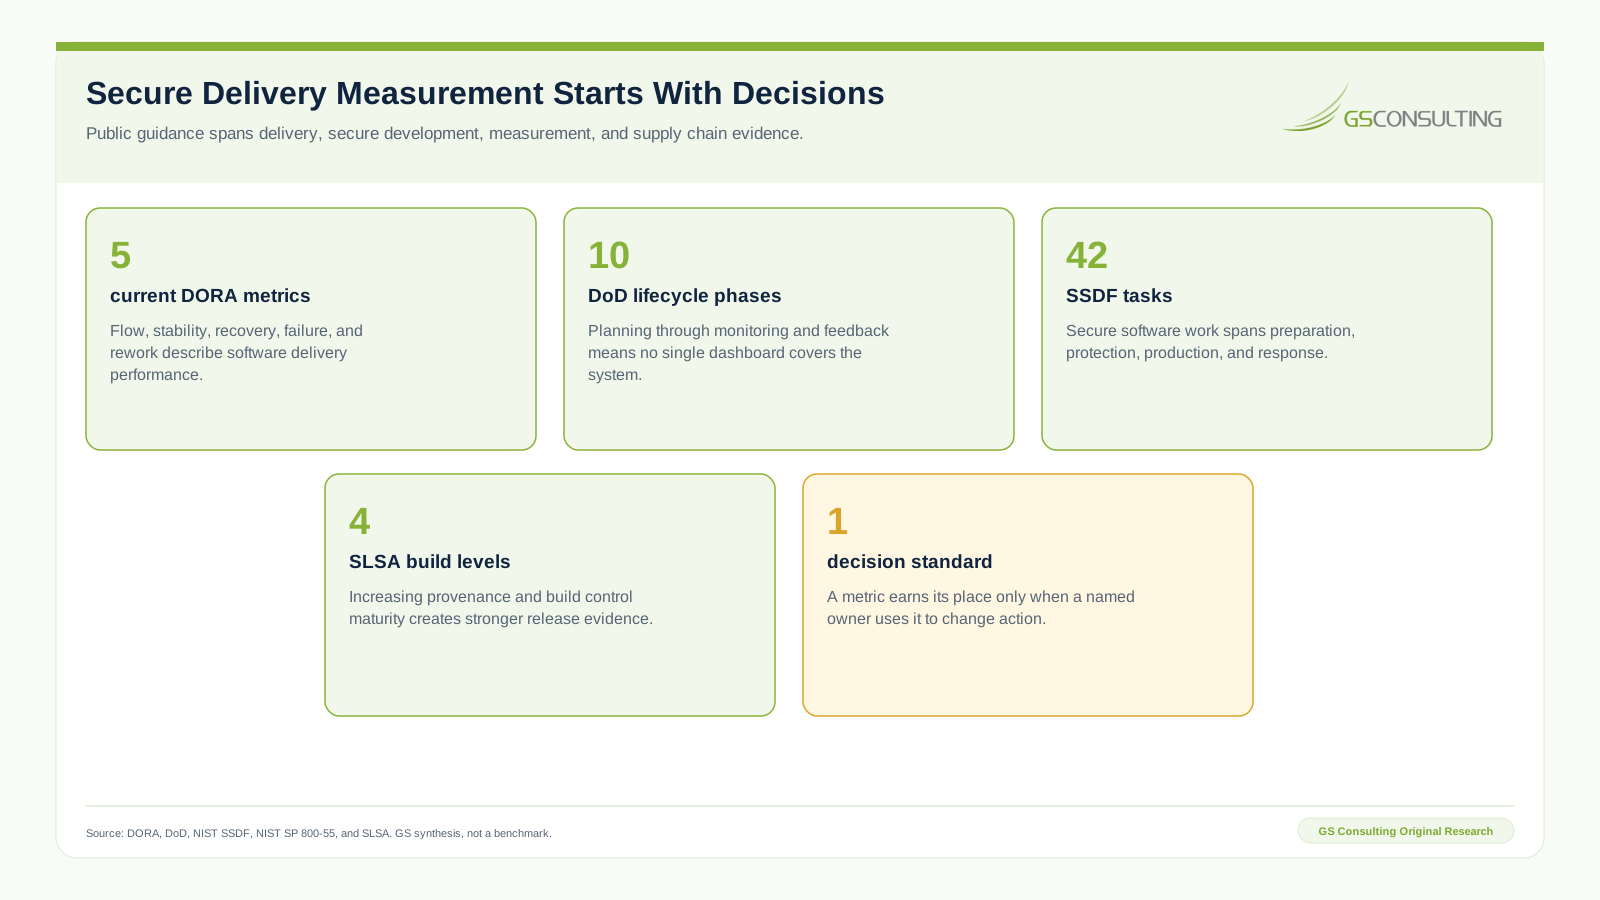
DORA currently defines five software delivery performance metrics: change lead time, deployment frequency, failed deployment recovery time, change fail rate, and deployment rework rate. The DORA metrics history explains that deployment rework rate joined the model in 2024. Teams still quoting four metrics are using an older version.
The DoD Enterprise DevSecOps Fundamentals version 2.5 describes ten lifecycle phases and references both delivery performance and service health signals. That breadth matters. Secure delivery is not one pipeline job. Planning, development, build, test, release, delivery, deployment, operation, monitoring, and feedback all create facts that leaders may need.
NIST SP 800-218 Secure Software Development Framework organizes secure development through four practice groups and 42 tasks. NIST SP 800-55 Volume 1 adds the measurement discipline: define purpose, select measures, address data quality and uncertainty, analyze results, and improve the program. SLSA version 1.2 provides increasing build and provenance assurance. Together, these sources argue for a linked measurement system rather than one security total.
Original Research: The GS Secure Delivery Decision Signal Index
Not every available metric deserves management attention. Rank signals by decision value before building the dashboard.
GS Consulting scored 14 candidate DevSecOps metrics across five factors. Decision leverage carries 25 percent. Feedback speed, release traceability, and outcome connection each carry 20 percent. Resistance to gaming carries 15 percent. Each factor receives an ordinal rating from one to five. The weighted result is multiplied by 20 and reported on a zero to 100 scale.
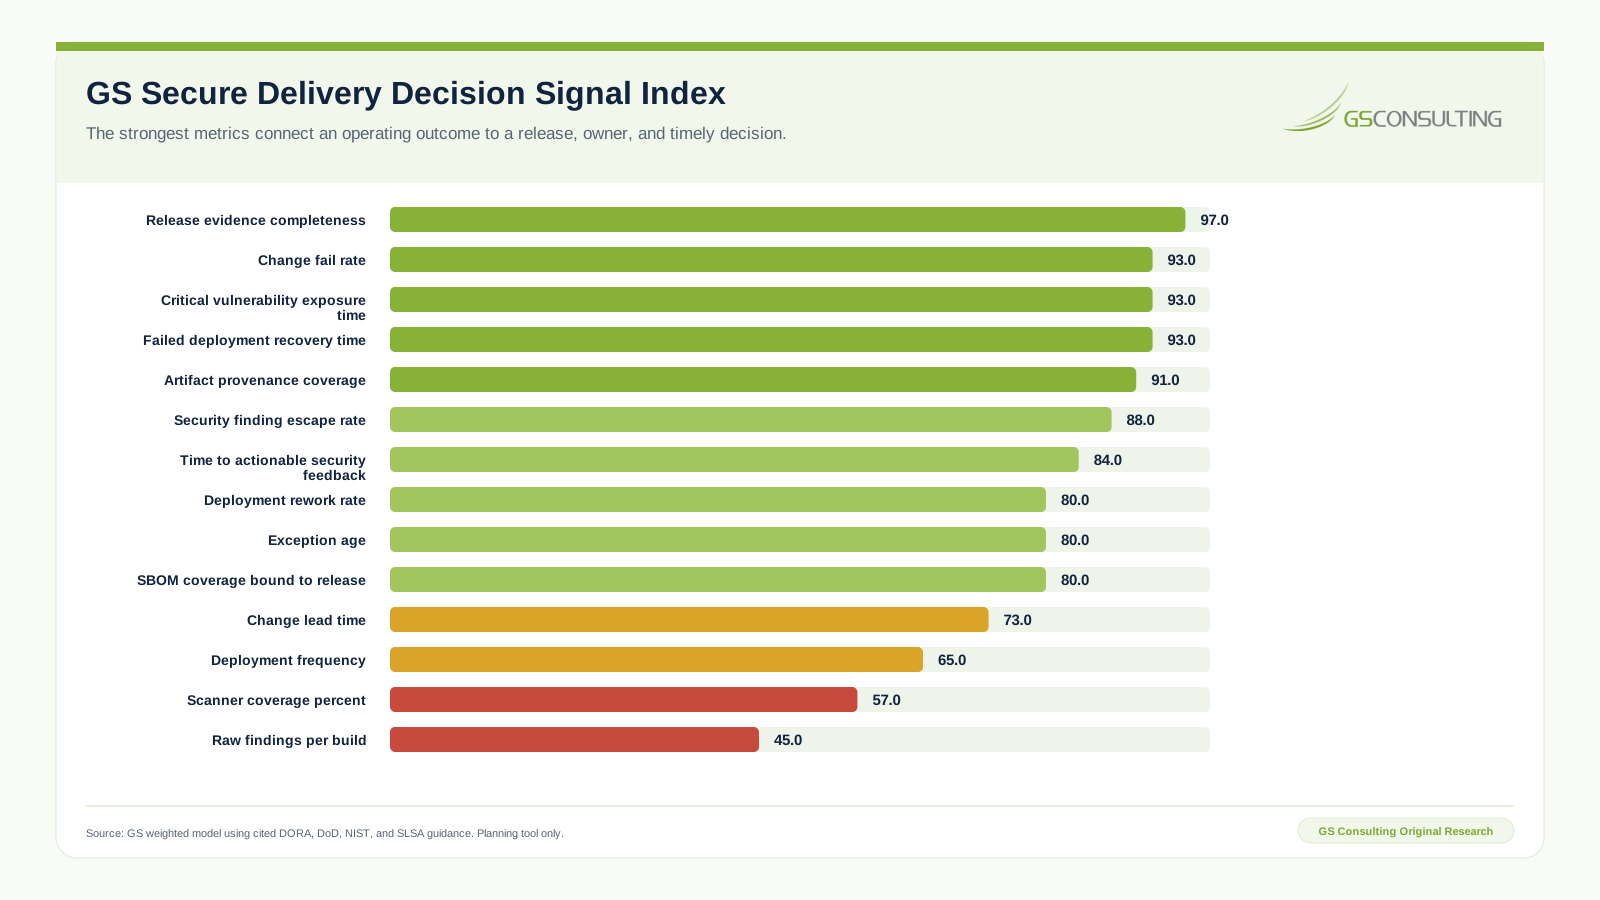
Release evidence completeness scores 97. Change fail rate, critical vulnerability exposure time, and failed deployment recovery time each score 93. Artifact provenance coverage scores 91. These signals rank highest because they bind an important outcome to a defined release and an action that leaders can verify.
Security finding escape rate scores 88. Time to actionable security feedback scores 84. Deployment rework rate, exception age, and SBOM coverage bound to release each score 80. Change lead time scores 73 and deployment frequency scores 65. The lower placement does not make flow unimportant. It means speed needs stability, security, and traceability context before it can direct a secure release decision.
Scanner coverage percent scores 57. Raw findings per build scores 45. Both can help operators diagnose the pipeline. Neither is a strong executive outcome on its own. More scanning can increase finding volume. A team can improve coverage without reducing exposure, assigning owners, or closing a single risk decision.
The sensitivity case shifts five percentage points from decision leverage to feedback speed. No score moves more than two points. The five leading signals keep their positions. That stability supports the sequence under the stated assumptions.
The GS Secure Delivery Decision Signal Index is a derived planning tool based on cited public sources and documented GS assumptions. It is not an official DORA, DoD, NIST, SLSA, legal, audit, compliance, authorization, or regulatory determination. Replace the assumptions with local evidence and accountable judgment.
Build a Balanced Secure Delivery Scorecard

The scorecard should answer three questions in a minute. Is the delivery system moving? Is it producing avoidable failure or exposure? Can the team reconstruct the release and the decision? One metric cannot answer all three.
Organize the page into eight compact families: flow, stability, recovery, exposure, escape, traceability, decision quality, and exception health. Show the current value, recent trend, target or threshold, affected population, data quality warning, and accountable owner. Let teams drill into repositories, services, severity, mission function, and release when they need detail.
Keep diagnostic telemetry near the team that uses it. Test duration, queue time, scanner coverage, flaky test rate, secret detection counts, and runner saturation can be valuable. Promote them to the management scorecard only when a named decision depends on them.
Use the Five Current DORA Metrics Correctly
Change lead time measures elapsed time from code committed to code running in production. Deployment frequency measures how often the organization deploys to production. Failed deployment recovery time measures how long it takes to recover from a failed production deployment. Change fail rate measures the share of deployments that cause degraded service and need remediation. Deployment rework rate measures the share of deployments that are unplanned work to repair a recent change.
Do not combine the five into one maturity score. A product can deploy often and recover slowly. Another can deploy rarely with a low observed failure rate because each release is huge. Keep the metrics separate, then read their relationship.
Segment before judging. A customer portal, an internal analytic service, an embedded mission system, and an infrastructure platform face different release constraints. Compare a product with its own history and an appropriate peer group. A company wide average erases the operating boundary.
Define the production event. Teams often count a package publish, a feature flag change, a configuration promotion, and a full deployment differently. Pick a rule that reflects customer impact, document it, and keep the release identity through every source system.
Measure Exposure, Escape, Feedback, and Exceptions
Critical vulnerability exposure time starts when the organization confirms that a severe condition affects a deployed component or reachable path. It stops at verified remediation or a documented, time bound exception. The definition should state severity source, reachability rule, environment, owner, clock pauses, and verification event.
Security finding escape rate asks what the delivery system should have detected before release but did not. Use confirmed production findings as the numerator and a defined population of relevant confirmed findings as the denominator. Review escaped findings for control improvement, not blame.
Time to actionable security feedback measures the delay from change submission to a finding that has enough context for an owner to act. A scanner that responds in seconds but creates an unactionable ticket three days later is not fast. Include ownership, affected component, release context, evidence, and required action in the end condition.
Exception age measures how long accepted security risk remains open. Report by severity, system, owner, due date, and renewal history. An average can hide a small set of very old exceptions. Show the oldest items and the share past due. A temporary exception without expiry and review is permanent risk with softer language.
Bind Supply Chain Evidence to the Release
Artifact provenance coverage is the share of released artifacts with verifiable provenance that identifies where, when, and how the artifact was produced. The SLSA provenance specification provides a structured basis. Coverage should require successful verification, not merely the presence of a file.
SBOM coverage bound to release is the share of released artifacts with a validated software bill of materials that identifies the exact artifact and release. An inventory with the right product name but the wrong hash or build is not covered. The companion SBOM guide for federal delivery teams defines generation, validation, distribution, and consumption controls.
Release evidence completeness is the share of production releases with every required record present and linked. The required set commonly includes the change record, test and security results, finding dispositions, artifact identity, provenance, SBOM, approval, deployment proof, health check, and rollback readiness. Tailor the set to the system and authorization boundary.
NIST SP 800-204D connects software supply chain security strategies to continuous integration and delivery pipelines. The practical metric lesson is simple: a control result matters most when it can be tied to the artifact that actually moved.
Set Targets From Consequence and Baseline
There is no universal good number for every DevSecOps metric. The right threshold depends on mission effect, user tolerance, exploitation risk, service architecture, recovery design, release pattern, staffing, and contract conditions. A target copied from another organization creates false precision.
Start with at least one complete delivery cycle and enough releases to understand variation. Show the median and a severe tail such as the 90th percentile where volume supports it. For low volume systems, review individual events and rolling windows. Always show the denominator.
Set two kinds of thresholds. An operating threshold triggers immediate action, such as rollback, incident response, or exception review. An improvement target directs investment over a stated period. Do not confuse them. Missing an improvement target is not automatically an incident. Crossing a release gate should not wait for a monthly meeting.
Record target changes with rationale and approval. Otherwise teams can move the line to make performance look better. Review targets after major product, architecture, data, mission, threat, or control changes.
Connect Every Metric to a Decision Loop
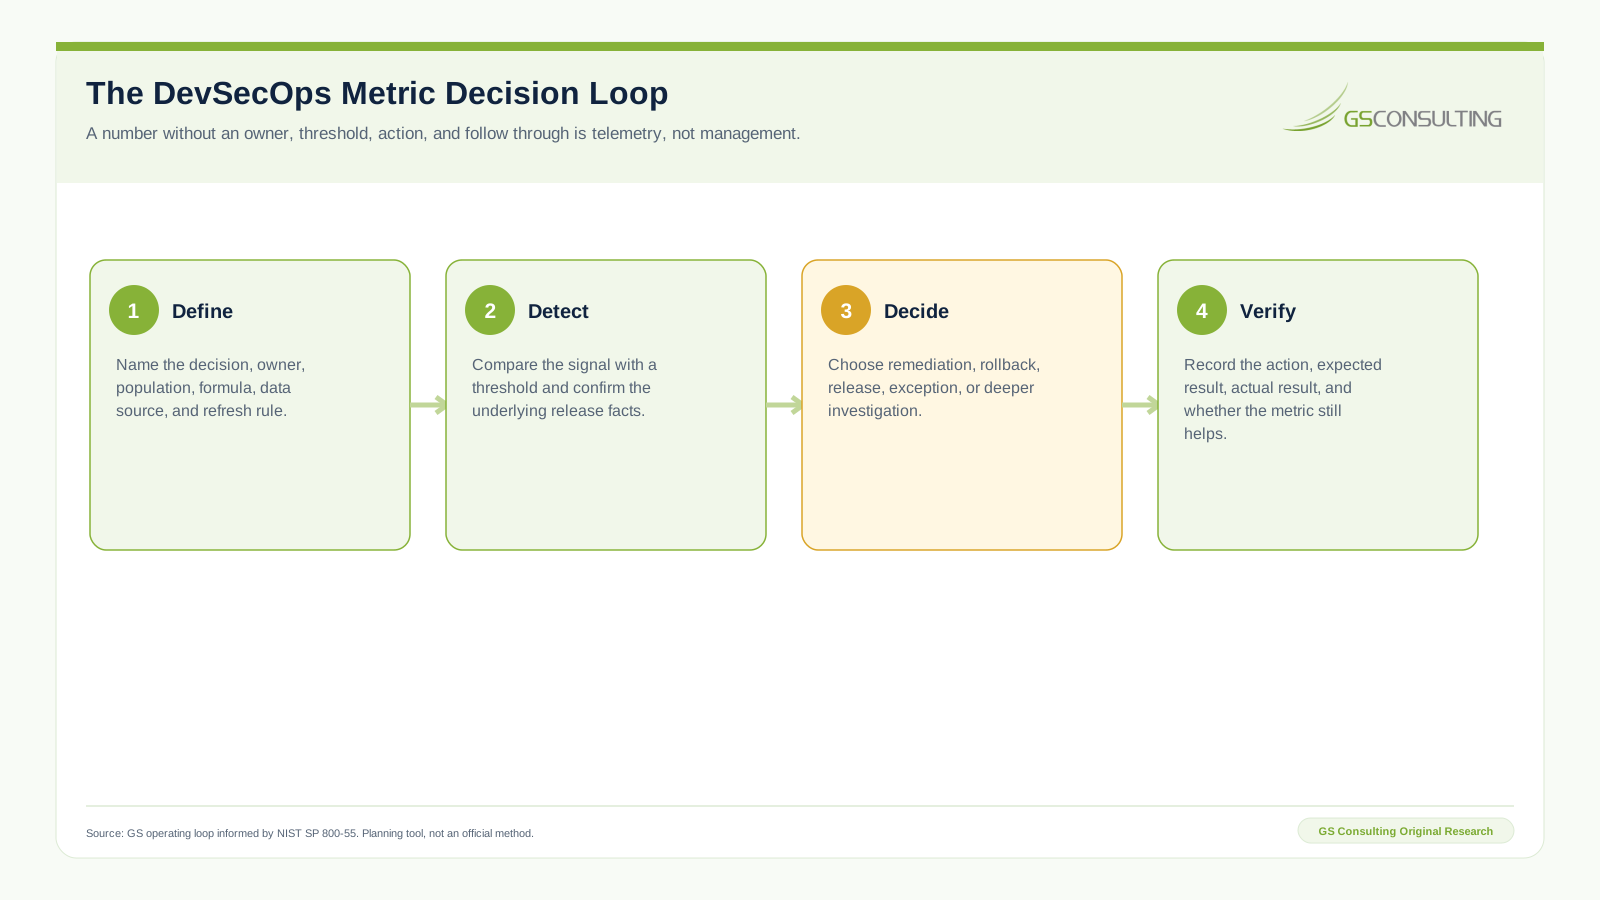
Define the metric contract first. Name the decision, owner, population, numerator, denominator, units, exclusions, source systems, transformation, refresh rule, quality check, threshold, and expected action. Store the definition beside the query or code that produces it.
When a threshold fires, confirm the underlying facts. A missing deployment record, duplicate scanner event, clock mismatch, or partial service population can create a false signal. Data quality is part of the metric, not an appendix.
The owner then chooses an action: remediate, investigate, roll back, block release, accept risk temporarily, adjust capacity, or revise a control. Preserve the decision and its conditions. Finally, verify whether the action produced the expected result and whether the metric remains useful.
Avoid Six Common Metric Failure Modes
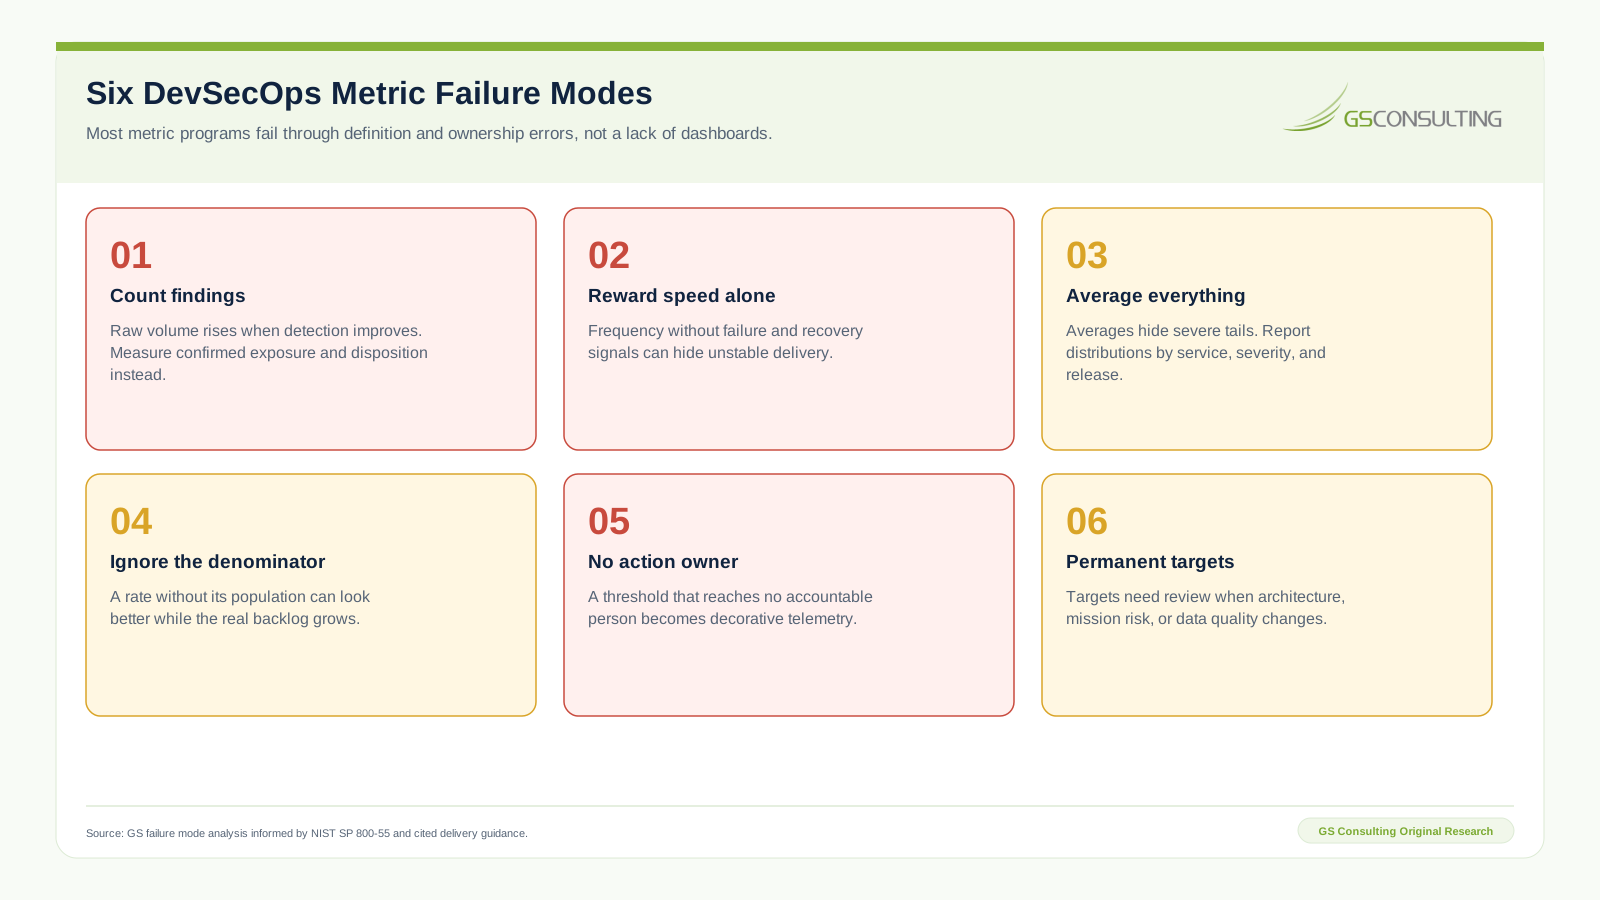
Counting findings: raw volume rewards noisy detection and punishes broader coverage. Pair volume with confirmation, exposure, ownership, disposition, and escape.
Rewarding speed alone: deployment frequency can improve while failure and repair work grow. Keep flow beside stability and recovery.
Averaging everything: an acceptable mean can hide a severe service, old exception, or long recovery tail. Show distributions and named outliers.
Ignoring the denominator: 20 findings mean little without the number of releases, components, assets, or scanner events behind them. Preserve both parts of every rate.
Assigning no action owner: a threshold that reaches a generic mailbox becomes a report, not a control. Name the person or operating role that must decide.
Keeping permanent targets: architecture, users, threats, and delivery patterns change. Review the target and the metric itself. Retire measures that no longer support a decision.
Use Metrics as Federal Delivery Evidence, Not as a Substitute for Judgment
Federal and defense teams often need to support authorization, contract, engineering, and mission assurance decisions at the same time. A metric can show control health and surface change. It does not replace the control evidence, assessment method, system boundary, contract requirement, or accountable official.
The DoD continuous authorization implementation guide and evaluation criteria emphasize current evidence and a delivery system that can sustain ongoing risk decisions. Use metrics to identify where evidence, control performance, or operating discipline needs review. Do not label a scorecard as continuous authorization.
The DoD DevSecOps reference design guide explains the current document stack and why teams should not treat the expired 2021 architecture as a universal blueprint. The AI assisted DevSecOps pipeline guide shows how automation can enrich evidence while accountable people retain release and exception authority.
A 90 Day DevSecOps Metrics Roadmap
Days 1 through 15: select one product or service. Map the release event, production boundary, repositories, build system, artifact registry, deployment platform, scanner outputs, finding system, incident records, and exception register. Name the five decisions leaders make repeatedly.
Days 16 through 30: define the first five metrics. Write the metric contracts, establish source identifiers, test joins, and quantify missing data. Do not publish targets yet. Produce a baseline with sample release records that operators can replay.
Days 31 through 60: publish the balanced scorecard to the people who own the decisions. Set review cadence, operating thresholds, escalation paths, and action records. Add change lead time, deployment frequency, security escape, exception age, or SBOM coverage only when the source data passes quality checks.
Days 61 through 90: run decision drills. Pick a failed deployment, critical exposure, expired exception, and incomplete release packet. Confirm that the metric reaches the right owner and produces a recorded action. Review false signals, gaming opportunities, and missing populations. Retire anything nobody uses.
Keep a Minimum Metric Evidence Packet
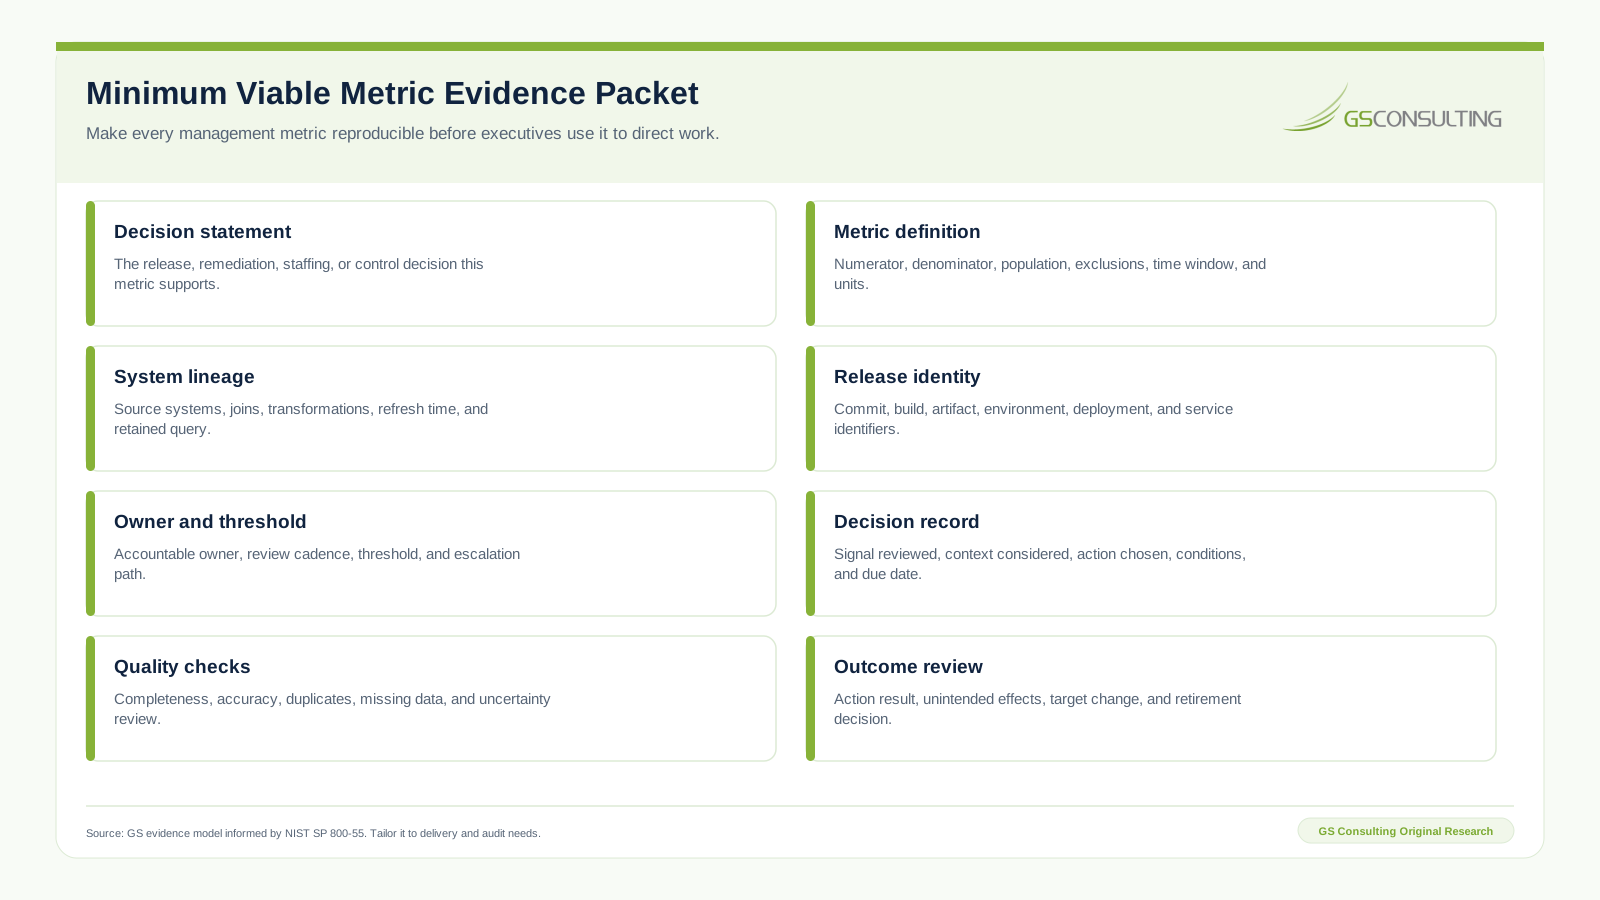
The minimum packet has eight records. Keep the decision statement, metric definition, source lineage, release identity, owner and threshold, decision record, data quality checks, and outcome review. Stable identifiers should connect the packet to the relevant release, artifact, finding, exception, incident, and service.
The packet does not need to be a document. It can be a governed set of linked records created by the delivery platform. The test is replay. An authorized reviewer should be able to reproduce the number, see what population it represented, identify who acted, and verify what happened next.
Retain according to the system, contract, records policy, authorization needs, and legal advice. More retention is not automatically better. The operating standard is sufficient, protected, retrievable evidence with an explicit owner and purpose.
Research Sources and Caveats
The GS index uses ordinal analyst ratings, not a representative performance dataset. Public sources establish definitions, lifecycle scope, measurement practices, and supply chain concepts. GS Consulting supplied the factor ratings, weights, thresholds, comparison set, and interpretation. Correlation among delivery, security, and business outcomes is not estimated.
- DORA: Current software delivery performance metrics
- DORA: Metrics history
- DoD Enterprise DevSecOps Fundamentals version 2.5
- NIST SP 800-218 Secure Software Development Framework version 1.1
- NIST SP 800-55 Volume 1
- NIST SP 800-204D
- DoD Continuous Authorization to Operate Implementation Guide
- DoD Continuous Authorization to Operate Evaluation Criteria
- SLSA specification version 1.2
- SLSA provenance specification
Frequently Asked Questions About DevSecOps Metrics
What are the most important DevSecOps metrics?
Start with change fail rate, failed deployment recovery time, critical vulnerability exposure time, release evidence completeness, and artifact provenance coverage. Add flow, rework, escape, feedback, exception, and SBOM metrics as source data becomes trustworthy.
Are DORA metrics enough for DevSecOps?
No. The five current DORA metrics describe delivery performance. Add a small set of security exposure, escape, artifact traceability, exception, and release evidence outcomes to manage secure delivery.
How should a team measure DevSecOps security?
Measure elapsed exposure, security escape, actionable feedback time, exception age, provenance coverage, SBOM release binding, and evidence completeness. Define the population, owner, threshold, action, and release identity for every metric.
What is a good DevSecOps dashboard?
A good dashboard is a compact decision surface. It shows current value, trend, distribution, target, data quality, affected population, and accountable owner. Each threshold leads to a defined operating action.
How often should DevSecOps metrics be reviewed?
Review cadence should follow the decision. Some signals need daily or continuous attention, while leadership trends may be weekly or monthly. Revisit definitions and targets after material system, mission, control, or data changes.
Do DevSecOps metrics prove compliance or authorization?
No. Metrics can support monitoring and evidence, but they do not prove compliance or grant authorization. The actual system, contract, data, controls, boundary, assessment method, and accountable officials govern those decisions.
Related DevSecOps Guidance
- DevSecOps Resource Hub
- What Is DevSecOps?
- Software Bill of Materials Guide
- DoD DevSecOps Reference Design Explained
- Automating DevSecOps Pipelines With AI
- DevSecOps and Software Supply Chain Services
No owner, no action, no metric.
Build the scorecard around the decisions your delivery system must make and the evidence those decisions must withstand.
Design the Metric Operating Standard