AI Governance | | 22 min read
AI Governance Metrics: Build an Executive Dashboard That Drives Decisions

Key Takeaways
A governance dashboard must expose the next decision
Nine signals require executive action
The GS model places nine of twelve signals in the executive action lane because unresolved authority, evidence, and response gaps can leave material exposure operating.
Never publish a number without its denominator
A percentage without complete scope can improve while unmanaged uses disappear from the count.
Every threshold needs an owner and response
A dashboard is useful when a crossed limit starts a named decision clock and the next report shows what changed.
AI governance metrics are not a report card. They are a decision system. If a number does not change authority, funding, restriction, remediation, or stop action, it does not belong on the executive dashboard.
Most governance dashboards count activity. Policies approved. Meetings held. People trained. Use cases reviewed. Those numbers can all rise while an unapproved high impact use operates, an exception expires, a monitoring gap persists, or a human override stops working.
Build the dashboard from exposure and decisions. Define the portfolio denominator. Show the few signals that can change a material outcome. Link each result to current evidence, a threshold, an accountable owner, a response clock, and the decision record. Keep the operating detail one click below the executive view.
The AI Governance hub connects measurement to inventory, roles, risk classification, exceptions, and oversight. Use the AI Model Inventory to establish scope, the AI Governance Risk Classification System to set reporting priority, and AI Governance Exception Management to connect thresholds to response. GS Consulting implements the operating model through AI Governance, Risk, and Oversight.
Turn AI reporting into executive decisions.
GS Consulting helps teams define the portfolio, measures, thresholds, evidence, owners, review cadence, and response rules for an AI governance dashboard that can survive challenge.
Plan a Governance Metrics WorkshopAI Governance Metrics: The Short Answer
An executive AI governance dashboard should answer six questions. Which important AI uses lack a current authority decision? Which approved uses are outside their operating limits? Which controls or monitoring signals are missing? Which reviews, exceptions, and corrective actions are overdue? How quickly is authority responding? Is the approved value appearing without an unacceptable increase in exposure?
Do not begin with a software template. Begin with the decisions the governance body can make. Approval. Restriction. Investment. Escalation. Pause. Retirement. For each decision, define the evidence that would justify it and the condition that starts the response.
Use three connected views. The executive view shows material exposure, trend, threshold, owner, and requested decision. The program view shows causes, age, tier, dependency, and action status. The operating view preserves the source records and lets owners correct the condition. One dataset should support all three.
Public Guidance Supports Action Focused Measurement
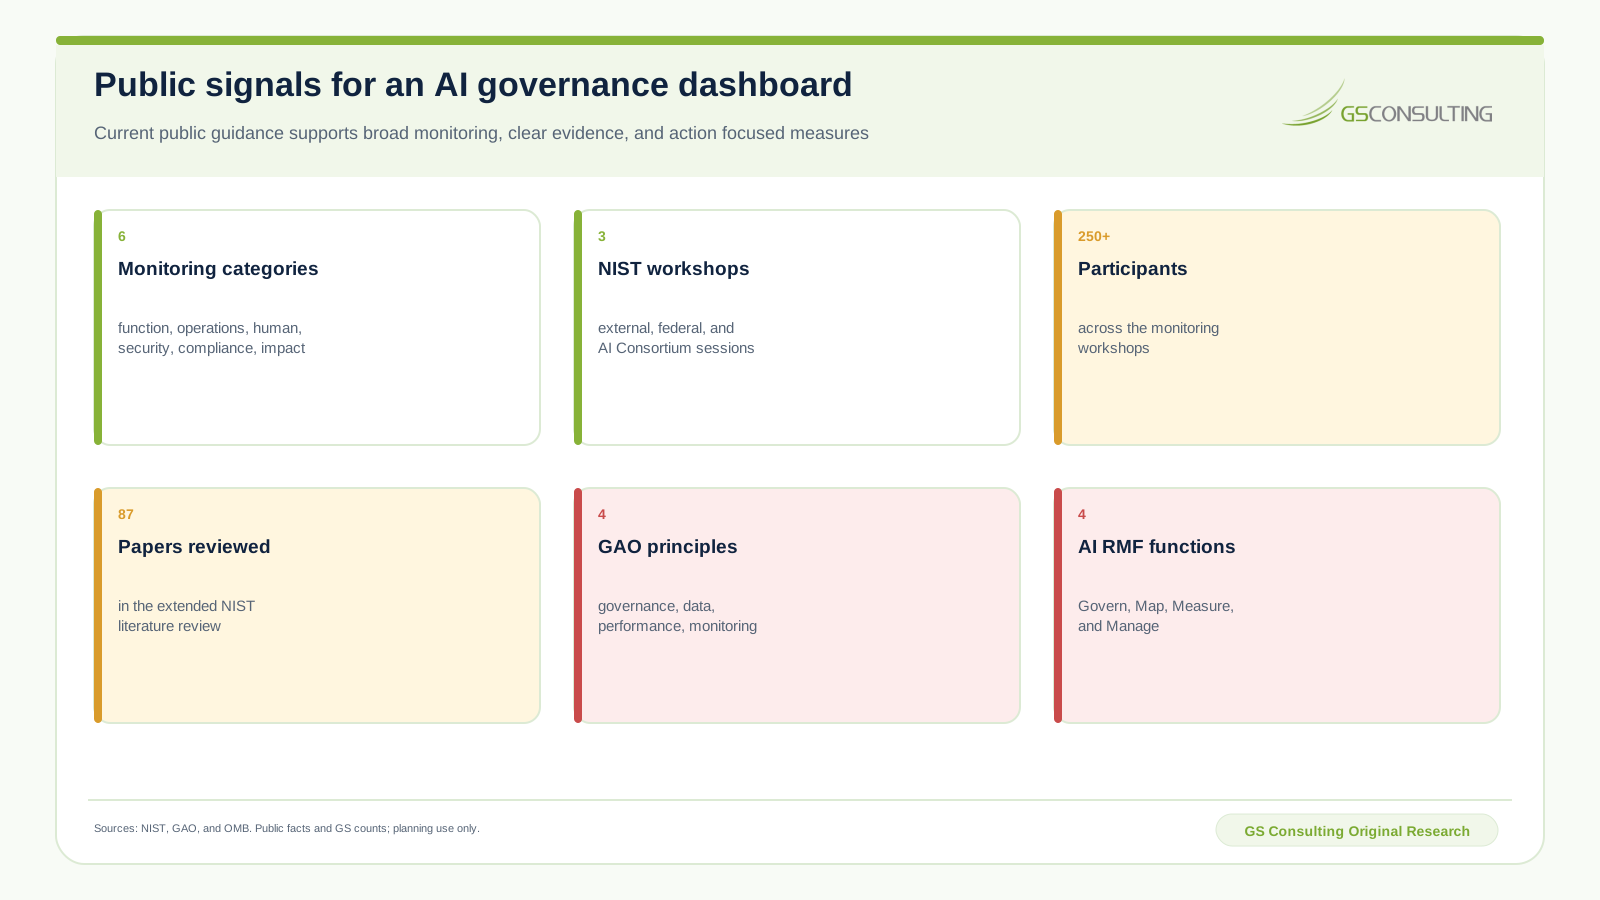
The NIST AI Risk Management Framework 1.0 organizes risk work through Govern, Map, Measure, and Manage. The NIST Measure Playbook calls for metrics tied to significant risks, acceptable limits, corrective action, accountability, complaints, overrides, and response. It also warns that measures can be gamed or oversimplified and should be reviewed for usefulness.
NIST published Challenges to the Monitoring of Deployed AI Systems in March 2026. The report organizes monitoring into six categories: functionality, operations, human factors, security, compliance, and large scale impacts. NIST drew on three workshops, more than 250 participants, and an extended review of 87 papers. It also says validated monitoring practice remains immature and scattered. A polished dashboard should not pretend the field has settled universal measures.
The GAO AI Accountability Framework connects governance, data, performance, and monitoring to traceability and corrective action. OMB M-25-21 sets annual inventory and ongoing risk management practices for covered federal agency uses. Its terms do not automatically govern a contractor internal use. The useful lesson is operating discipline, not borrowed legal status.
GS AI Governance Executive Signal Priority Index
GS Consulting built the Executive Signal Priority Index to answer one question: which portfolio signals most clearly tell leaders that authority, control, evidence, response, or value needs a decision?
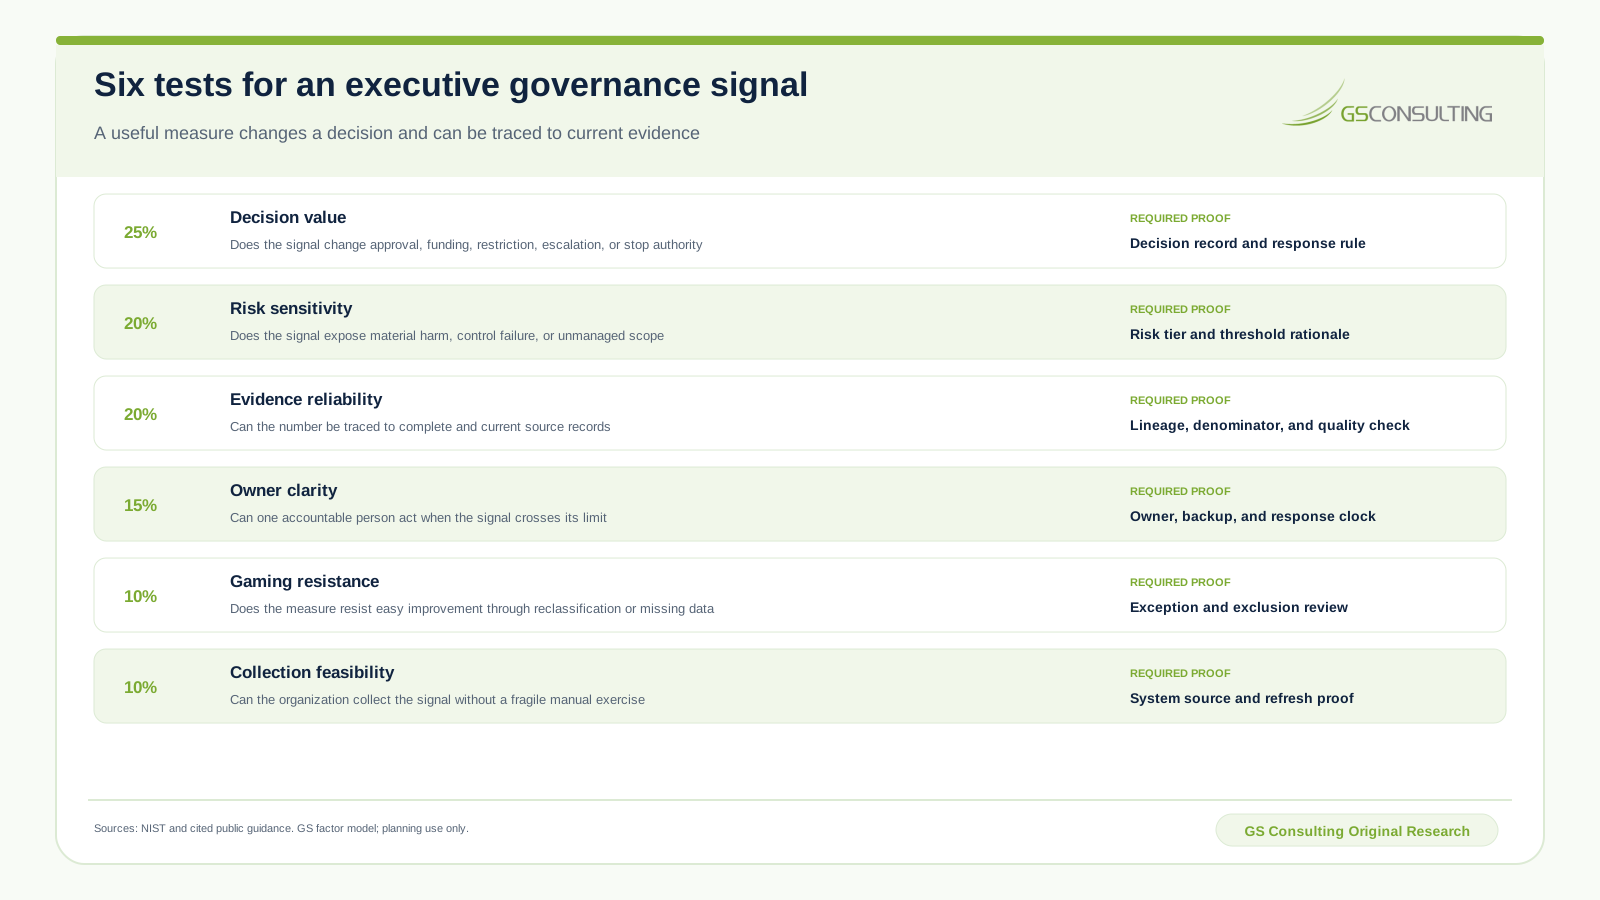
The model evaluates twelve representative signals across six factors. Decision value carries 25 percent. Risk sensitivity and evidence reliability carry 20 percent each. Owner clarity carries 15 percent. Gaming resistance and collection feasibility carry 10 percent each. Every factor receives a GS ordinal rating from one to five. The weighted result is scaled to 100.
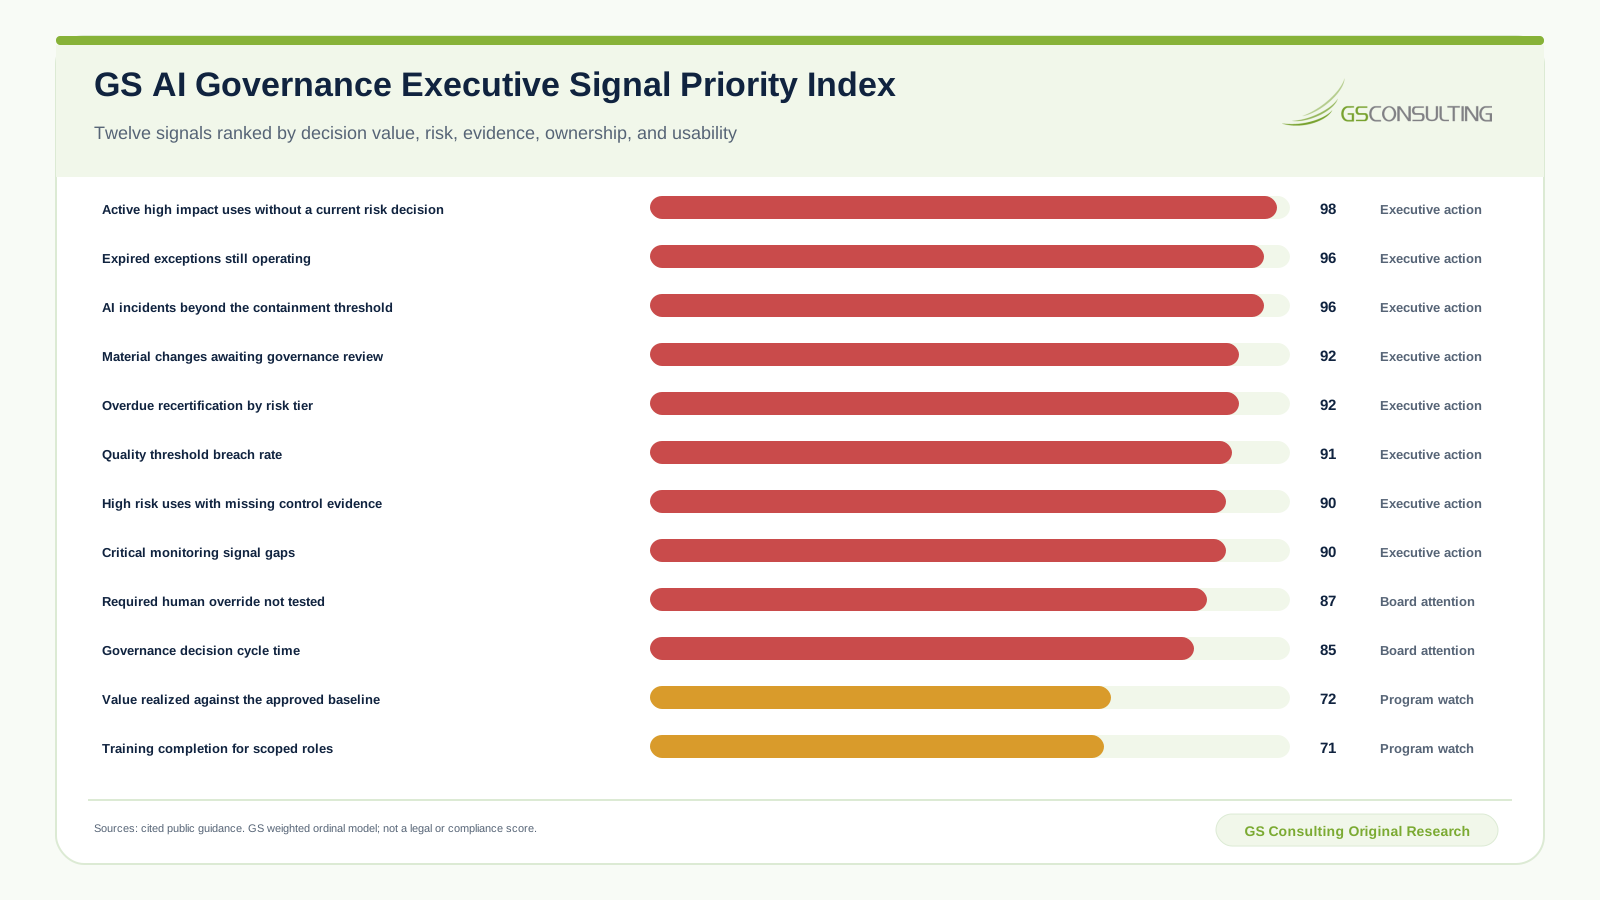
Active high impact uses without a current risk decision score 98. Expired exceptions and incidents beyond containment score 96. Material changes awaiting review and overdue recertification score 92. A quality threshold breach scores 91. Missing control evidence and critical monitoring gaps score 90. These nine signals enter the executive action lane.
An untested required human override scores 87 and governance decision cycle time scores 85. They enter the board attention lane. Value against the approved baseline scores 72, while training completion for scoped roles scores 71. Both matter, but neither should displace an unresolved authority or control condition from the first page.
The sensitivity case increases risk sensitivity and reduces evidence reliability by five points. No item moves more than two points. The leading action set remains stable. That is a directional stability check, not external validation. The ratings, weights, thresholds, and item set are documented GS assumptions and should be replaced with local evidence.
Use Three Dashboard Layers
The executive layer asks for a decision. Show no more than the material signals that can change authority, exposure, investment, or customer confidence. Each row needs current value, denominator, trend, threshold, owner, response clock, and requested action. Do not show a green summary when one red condition can stop the use.
The program layer explains the condition. Break the result down by risk tier, business owner, system, and provider. Then show control family, age, cause, and action state. This is where governance leaders see whether one bad record or a repeated design weakness drives the executive signal.
The operating layer preserves proof. Link to inventory, assessments, tests, exceptions, and incidents. Keep monitoring results, corrective actions, decisions, and closure evidence beside them. Operators need record level detail. Executives need confidence that the headline can be reconstructed.
Do not build three separate reporting systems. Use stable identifiers for the AI use, model, system, and decision. Link each control, exception, incident, and action through those records. The same source record should roll up without manual restatement.
The Core AI Governance Metrics
- Authority coverage. Count active uses by risk tier and show the number without a current approval, restriction, or risk decision. The denominator is every active use in the defined portfolio.
- Review currency. Show overdue recertification and periodic review by tier, age, owner, and material change status. Separate a missed calendar date from a use that changed before the date.
- Exception exposure. Show open and expired exceptions by consequence, control, age, renewal count, and operating restriction. An expired decision still operating is an authority failure.
- Incident and threshold response. Show conditions beyond containment or quality limits, time in each response state, and whether authority restricted, paused, corrected, or accepted the condition.
- Control evidence coverage. Show high risk uses missing current proof for required controls. Separate missing evidence from a tested control that failed.
- Monitoring coverage. Show critical uses without the required functionality, operations, human, security, compliance, or impact signals. State which signal is missing and why.
- Human authority proof. Show whether required review, override, appeal, stop, and recovery paths were tested with representative users and current system behavior.
- Decision speed. Measure time from complete intake to authority decision. Split acknowledgement, evidence gathering, review, decision, implementation, and verification so delay has an owner.
- Value against baseline. Compare approved operating value with the documented baseline and cost. Pair value with exposure. Cheap output is not value when rework, review, incidents, or weak decisions rise.
Definitions, Denominators, and Thresholds Come First
A metric dictionary should state the decision, unit, formula, numerator, and denominator. Document included tiers, excluded records, and the source system. Then name the refresh rule, quality check, threshold, owner, and response. Without that record, two teams can publish the same label and measure different things.
Denominators are where dashboards become honest. If the inventory is incomplete, say how much of the expected portfolio is represented. If twelve high risk uses have current evidence out of fifteen known uses, report twelve of fifteen, not 80 percent alone. If three additional uses are suspected but not confirmed, show that uncertainty separately.
Set target, warning, and breach thresholds from local consequence and response capacity. Preserve the rationale. A federal agency rule, customer contract, incident duty, or sector requirement may set a harder trigger. Do not convert a planning threshold into a claim of compliance.
Protect against gaming. Review exclusions, reclassification, owner changes, closed records without proof, paused clocks, late source feeds, and shifts in the portfolio denominator. A number that improves because difficult uses disappeared from scope is a governance failure.
The Dashboard Decision Workflow
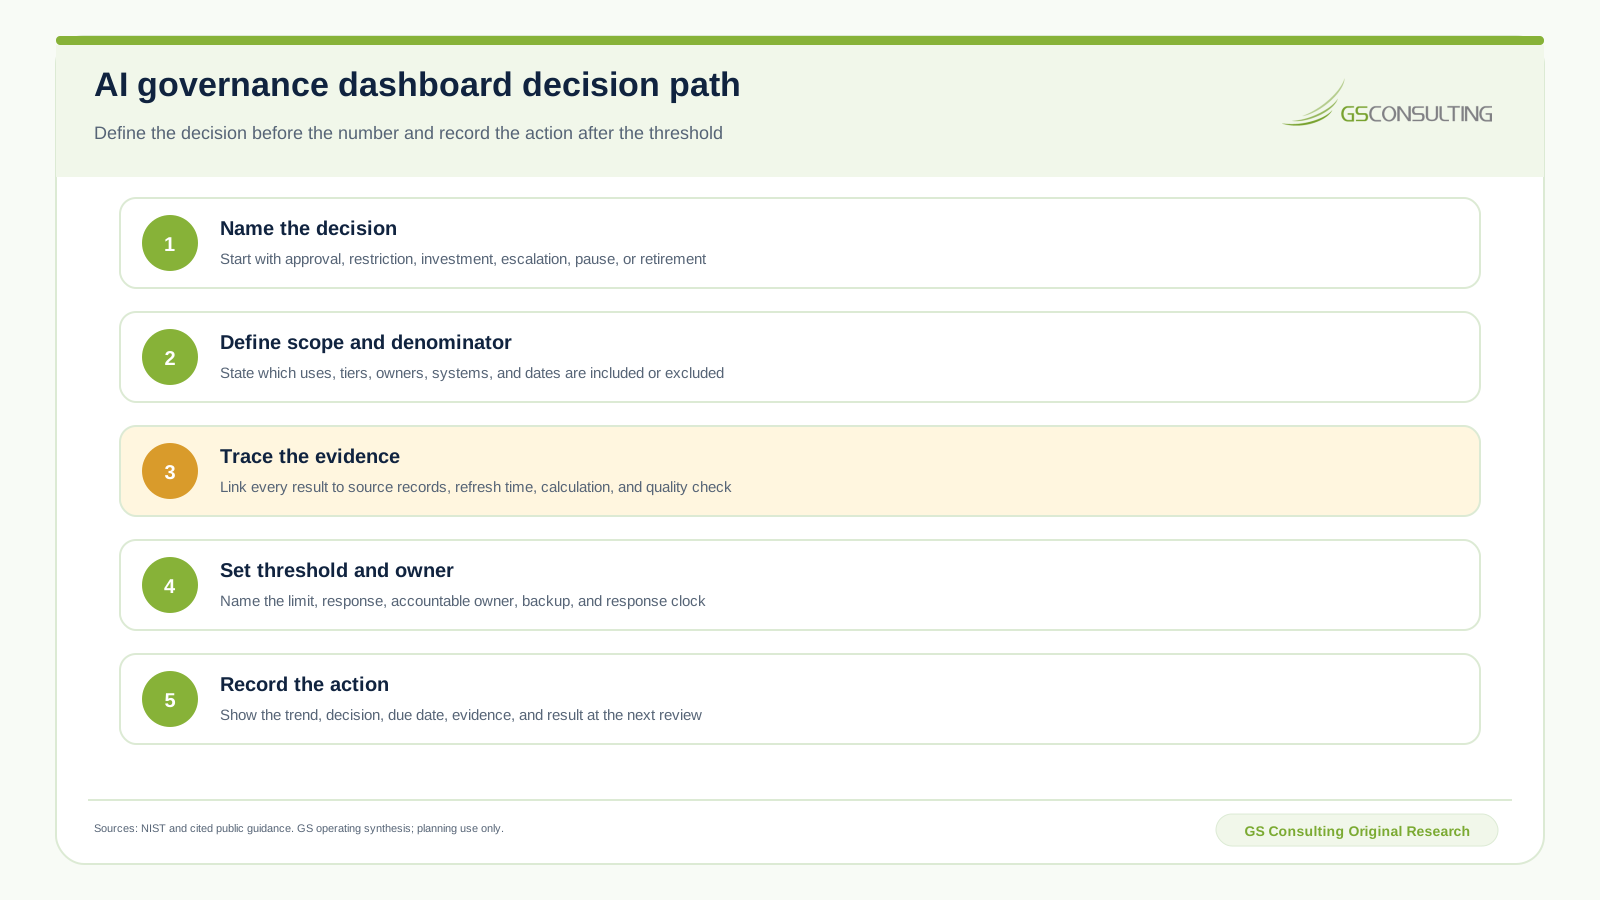
When a threshold is crossed, create a decision record. State the facts, affected uses, consequence, current restriction, and evidence. Record the unknowns, options, authority, and response clock. Then preserve the decision, action owner, due date, and verification rule. The next dashboard cycle should show whether the action changed the condition.
Use event driven escalation. An incident, approval bypass, material change, sensitive data expansion, expired exception, or critical control failure should not wait for a monthly presentation. The dashboard is the shared view of the response, not the gate that delays it.
Review metric utility at a set interval. Remove measures that never affect a decision. Split measures that hide different consequences. Add a measure only when its owner, evidence, threshold, and response are ready.
Six Dashboard Failures
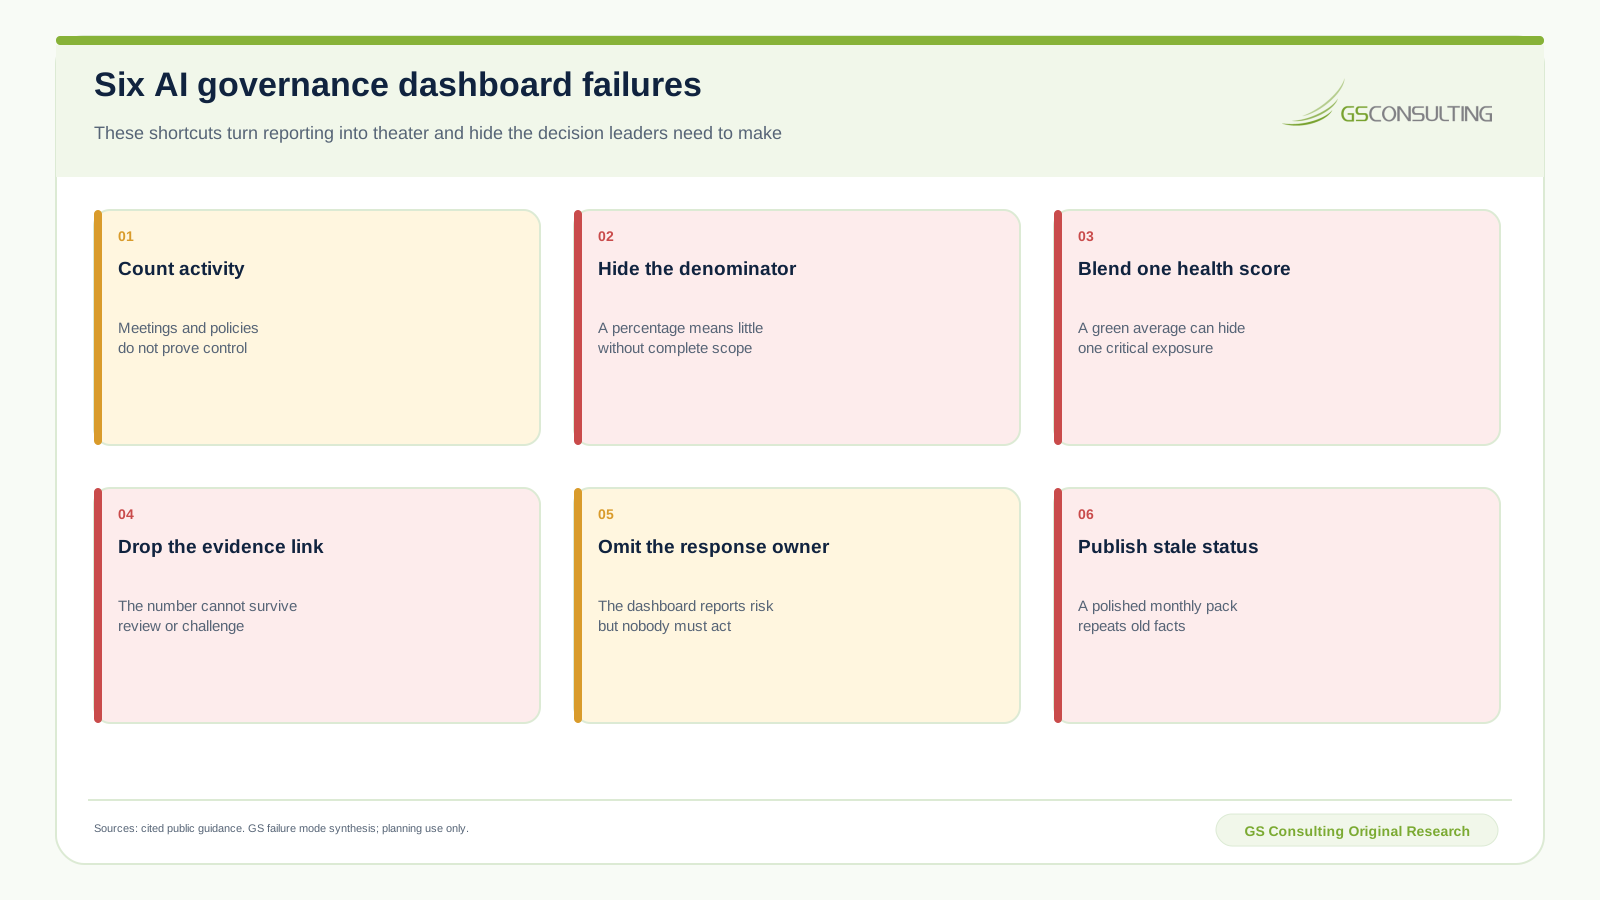
The most dangerous failure is one health score. Ten green conditions can average away one critical use that lacks authority. The second is a percentage without scope. A team can improve approval coverage by excluding hard cases from the inventory.
Stale status is just as damaging. A monthly pack may be correct when prepared and wrong when read. Publish the refresh time. Let urgent signals update outside the presentation cycle. Keep the source link beside the result.
The Minimum Dashboard Evidence Packet
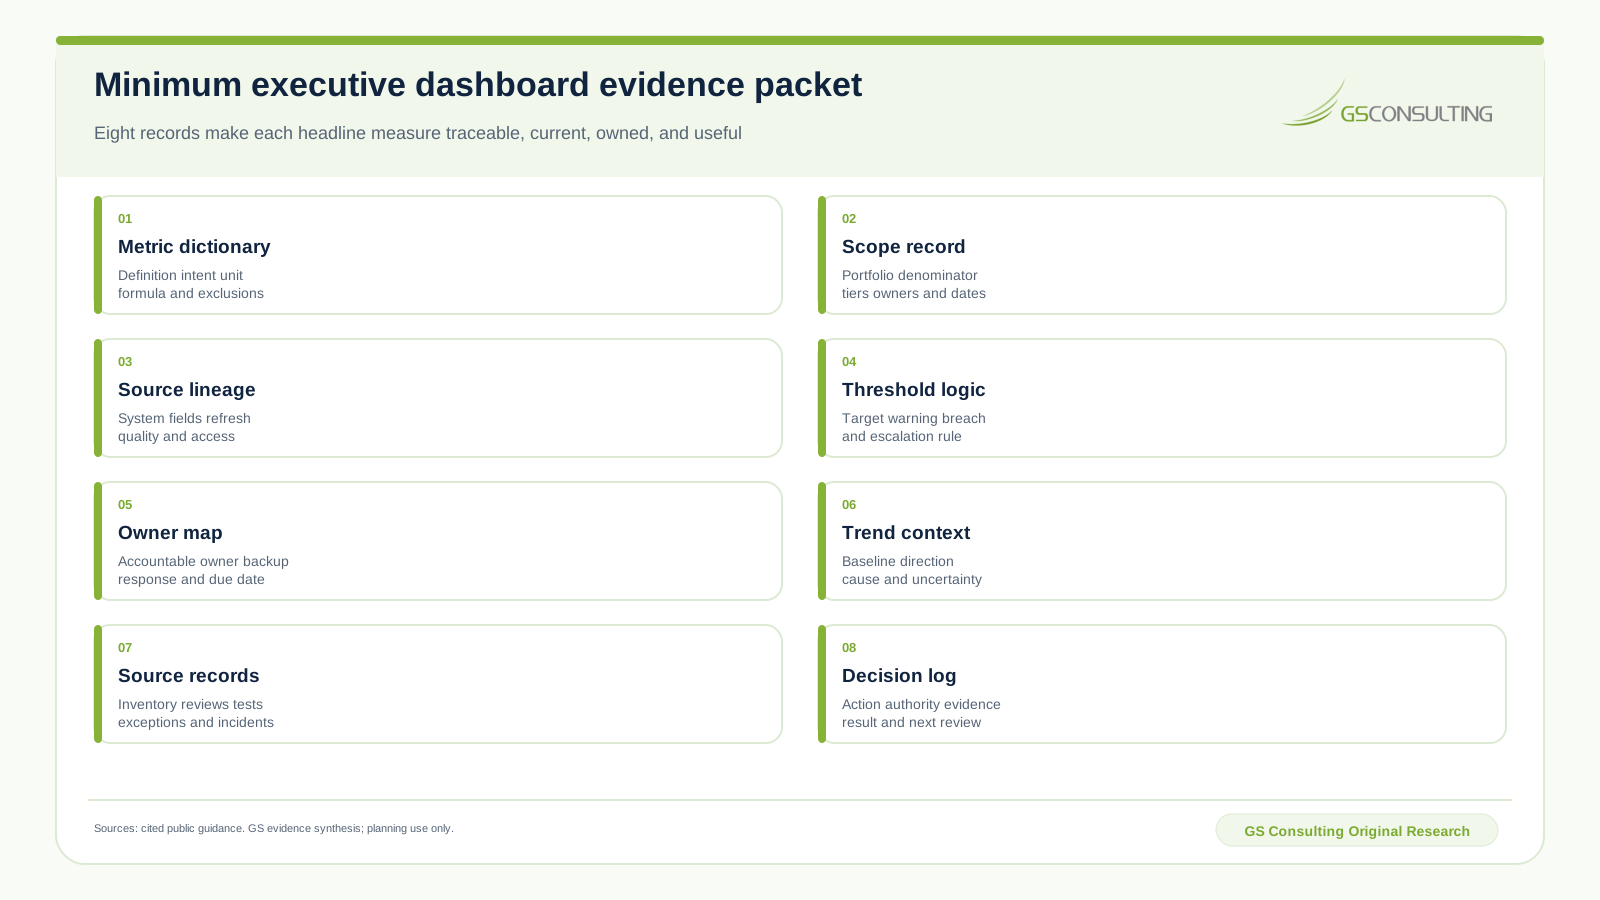
Keep the eight linked records shown above. Version them. Record changes to the formula, threshold, source, and exclusions. Preserve every owner and reporting cadence change too.
A reviewer should be able to take one red signal and reproduce the value from source records. The reviewer should also see who decided, what changed, whether the action worked, and when the condition will be reviewed again.
A Ninety Day Implementation Plan
Days 1 through 30: define the portfolio, decisions, risk tiers, stable identifiers, and source systems. Complete the metric dictionary, thresholds, owners, and current data gaps. Publish coverage and uncertainty before publishing a polished score.
Days 31 through 60: build the operating dataset and three dashboard layers. Connect inventory, classification, review, and exception records. Add incident, control, monitoring, action, and value records. Test every formula and exclusion against representative cases.
Days 61 through 90: run executive and program reviews, exercise event escalation, reconcile source evidence, challenge the denominator, review gaming paths, remove measures that do not drive decisions, and record the first completed action cycle.
Sources and Method Note
The research package separates public observations, GS assumptions, formula driven outputs, sensitivity results, and exact figure data. Sources were accessed September 2, 2026.
- NIST Artificial Intelligence Risk Management Framework 1.0
- NIST AI RMF Playbook Measure Function
- NIST AI RMF Playbook Manage Function
- NIST AI 800-4, Challenges to the Monitoring of Deployed AI Systems
- GAO Artificial Intelligence Accountability Framework
- OMB M-25-21
- DoD Responsible AI Toolkit, Generative AI Version 1.0
Planning caveat: The GS AI Governance Executive Signal Priority Index is a derived planning tool based on cited public sources and documented assumptions. It is not an official legal, audit, compliance, NIST, OMB, GAO, DoD, ODNI, security certification, or regulatory determination.
Frequently Asked Questions
What are AI governance metrics?
They are traceable measures of portfolio coverage, material risk, control operation, review debt, incident response, decision speed, and realized value. Each measure needs a denominator, evidence source, threshold, owner, and response.
Which metrics belong on an executive dashboard?
Lead with unresolved high impact uses, expired exceptions, incidents, and material changes. Then show overdue reviews, missing control evidence, monitoring gaps, untested human authority, and quality breaches. Use speed and value as supporting context.
Should the dashboard use one health score?
No. A blended score can hide one critical exposure behind several green measures. Show material conditions separately.
How often should leaders review the dashboard?
Match cadence to consequence and change. Urgent signals should escalate when they occur. Program and executive reviews can use weekly, monthly, or quarterly cycles without delaying threshold action.
How does NIST AI RMF connect to metrics?
NIST links measurement to risk, limits, corrective action, monitoring, accountability, response, and metric effectiveness. The organization still defines local scope, thresholds, evidence, and authority.
What evidence supports a dashboard measure?
Keep its definition, scope, source lineage, refresh time, and calculation. Document exclusions, the quality check, threshold, and owner. Preserve the trend, source records, decision, due date, and result.
Continue Reading
A governance dashboard needs a stable portfolio record behind every executive signal. The enterprise AI portfolio management guide shows how those signals become funding, hold, stop, and retirement decisions.
- AI Governance Hub
- Enterprise AI Portfolio Management
- AI Governance Recertification and Periodic Review
- AI Governance Risk Classification System
- AI Governance Exception Management
- AI Audit Trails and Activity Logging
Bottom Line
Good AI governance metrics do not describe activity. They expose unresolved authority, control, evidence, response, and value.
The operating standard is decisive: no executive signal without a denominator, no threshold without an owner, and no dashboard cycle without a recorded action.
Build the dashboard around the decision.
GS Consulting helps governance leaders turn portfolio records into traceable signals, response rules, and executive action.
Start the Conversation